Etsy Search Analytics
Etsy’s Stats are a critical part of the product for sellers. They use information from stats to optimize the way they reach buyers on the platform. In early 2017, Stats was redesigned to match the rest of the first design system. The redesign got a lot of hate from sellers who said it looked beautiful but was useless in comparison to the previous version of stats. Unfortunately, iteration was put on hold because Etsy shifted priorities.
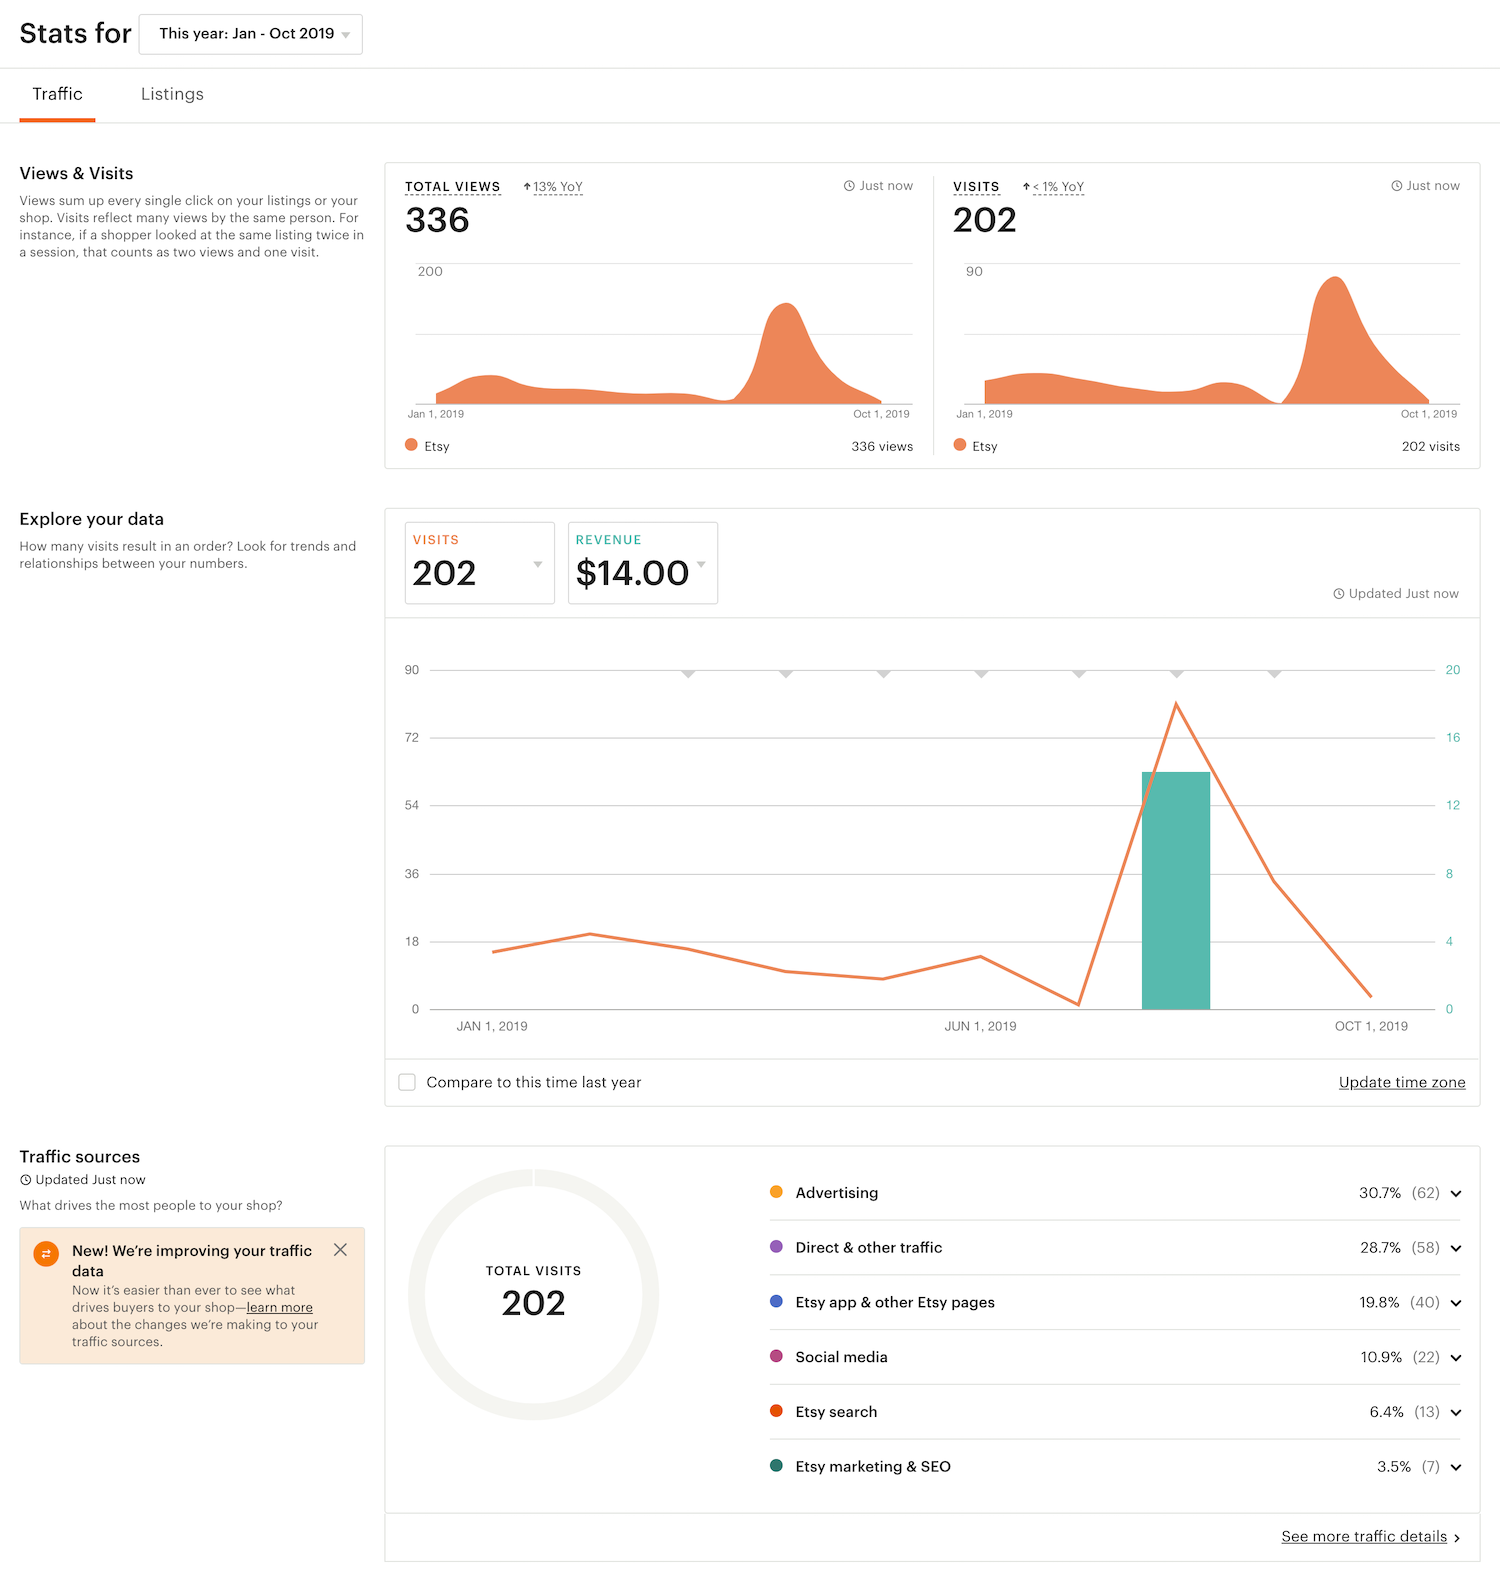 Etsy’s Stats in 2017.
After the launch of sales and coupons at Etsy in late 2017, the company was in a safe enough place to transition from table stakes emergency work to revolutionary experiences. When staffing conversations came up, my manager at the time said she wanted her best designer to be part of the effort to get Stats right. What followed was a multi-part project that spanned two years and involved lots of research.
Role
I was the lead designer on Etsy’s Stats. During this two-year time period, we released two products: search analytics and the new Stats. It included many updates that help sellers on Etsy better understand where their shop visits and revenue comes from. This post will explain the process of my first iteration: Search Analytics.
At the beginning of this project, my new team was affected by recent layoffs in that we had no engineers and 1/3 of a PM. This PM was balancing three projects at the same time while hiring managers searched for a full-time PM. Our engineering manager also had yet to hire any engineers. Even though there was little information about a staffing timeline, we were asked to get started.
User need
This project needed to fulfill a single customer goal:
As an active seller on Etsy, I need to understand the outlook of my business and identify potential actions I can take so I can grow my shop’s revenue.
Competitor audit
I compiled a massive amount of comparative research spanning a variety of direct and indirect competitors. Sellers monitor analytics on social media and other e-commerce websites to assess their reach. Many even use Google Analytics to cross-check data from Etsy. This all affected sellers’ expectations regarding Etsy’s Stats.
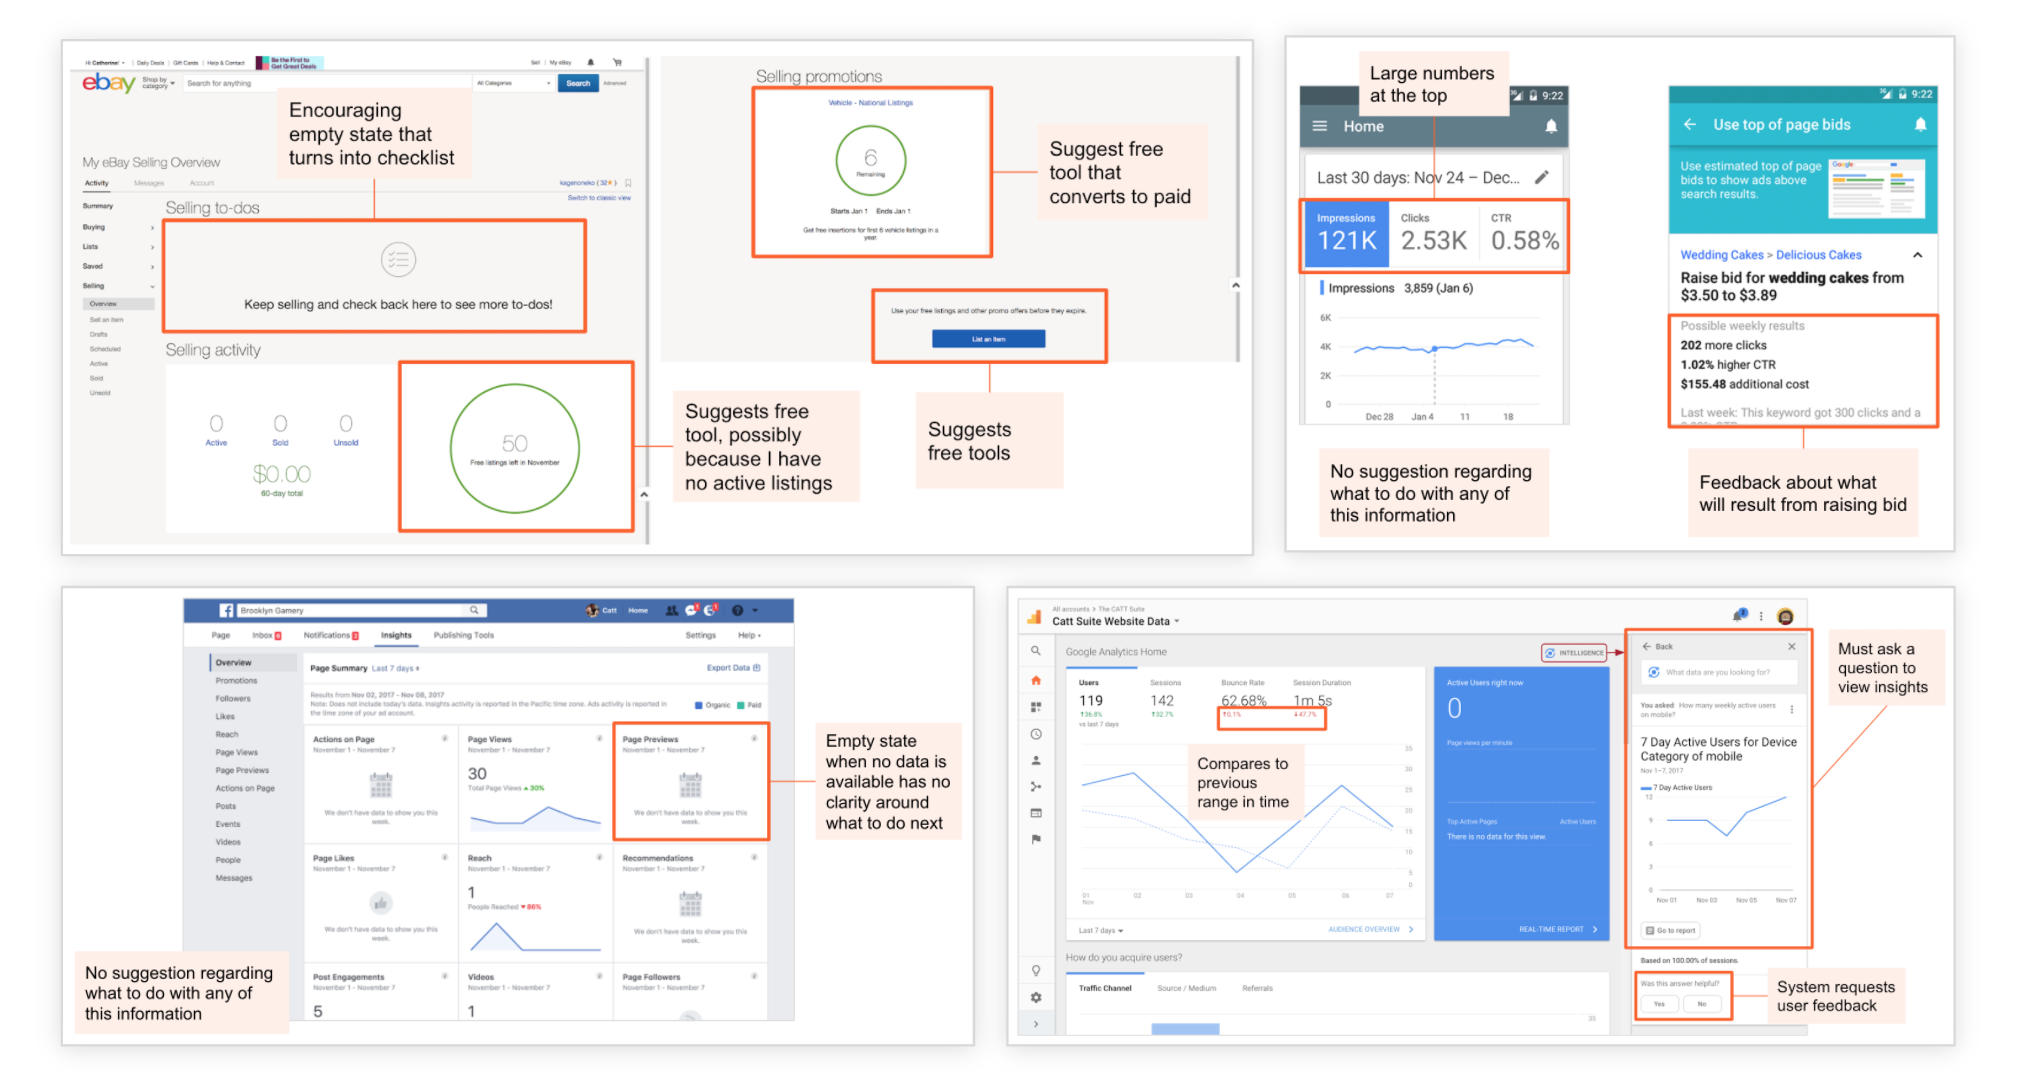 Competitive research examples.
Discovery research
Brian, the UX researcher, and I got creative and conducted all kinds of research to confirm which concepts would resonate with users. For example, our first research session was centered around user interviews about sellers’ goals—and how they use stats to track their progress. At the end of each session, we asked participants for feedback on several written concepts.
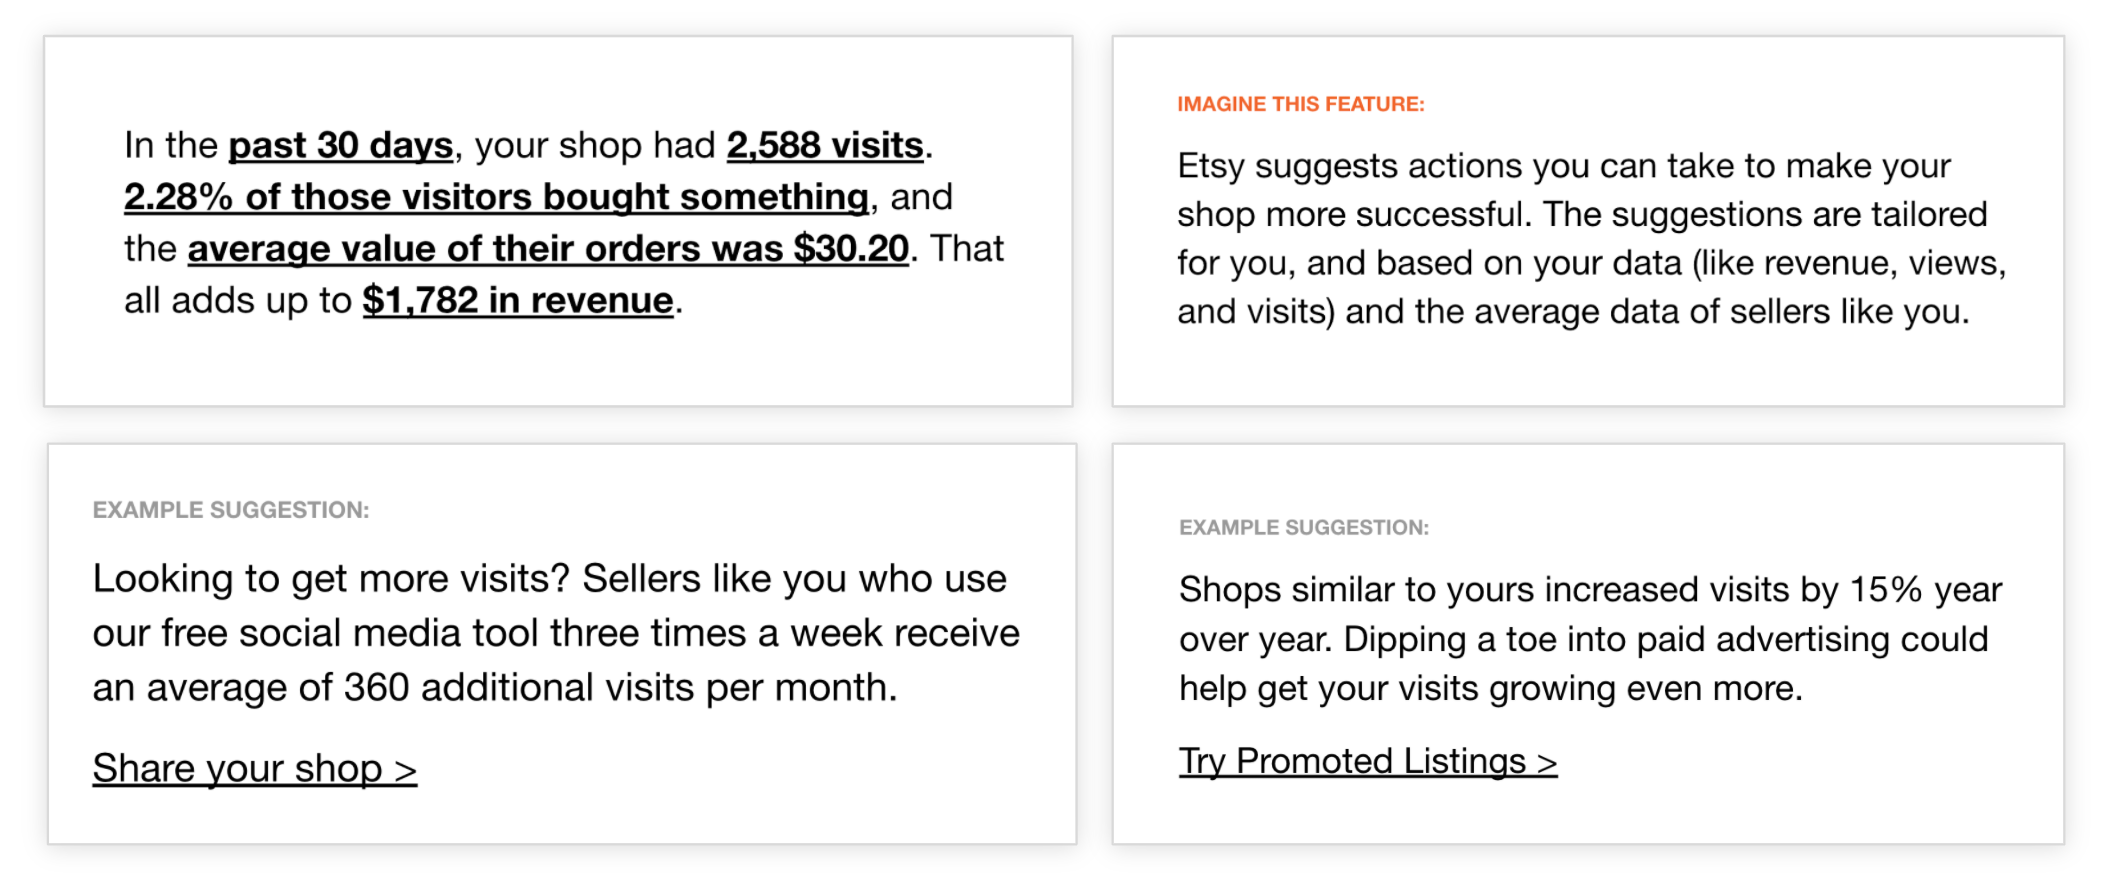 Some concepts we showed to sellers in our initial interviews.
This research confirmed that sellers don’t understand how to market their shops. Sellers were motivated by benchmarks and were open to suggestions from Etsy. Free suggestions were especially appealing, while paid ones needed to be personalized and come with an estimated impact.
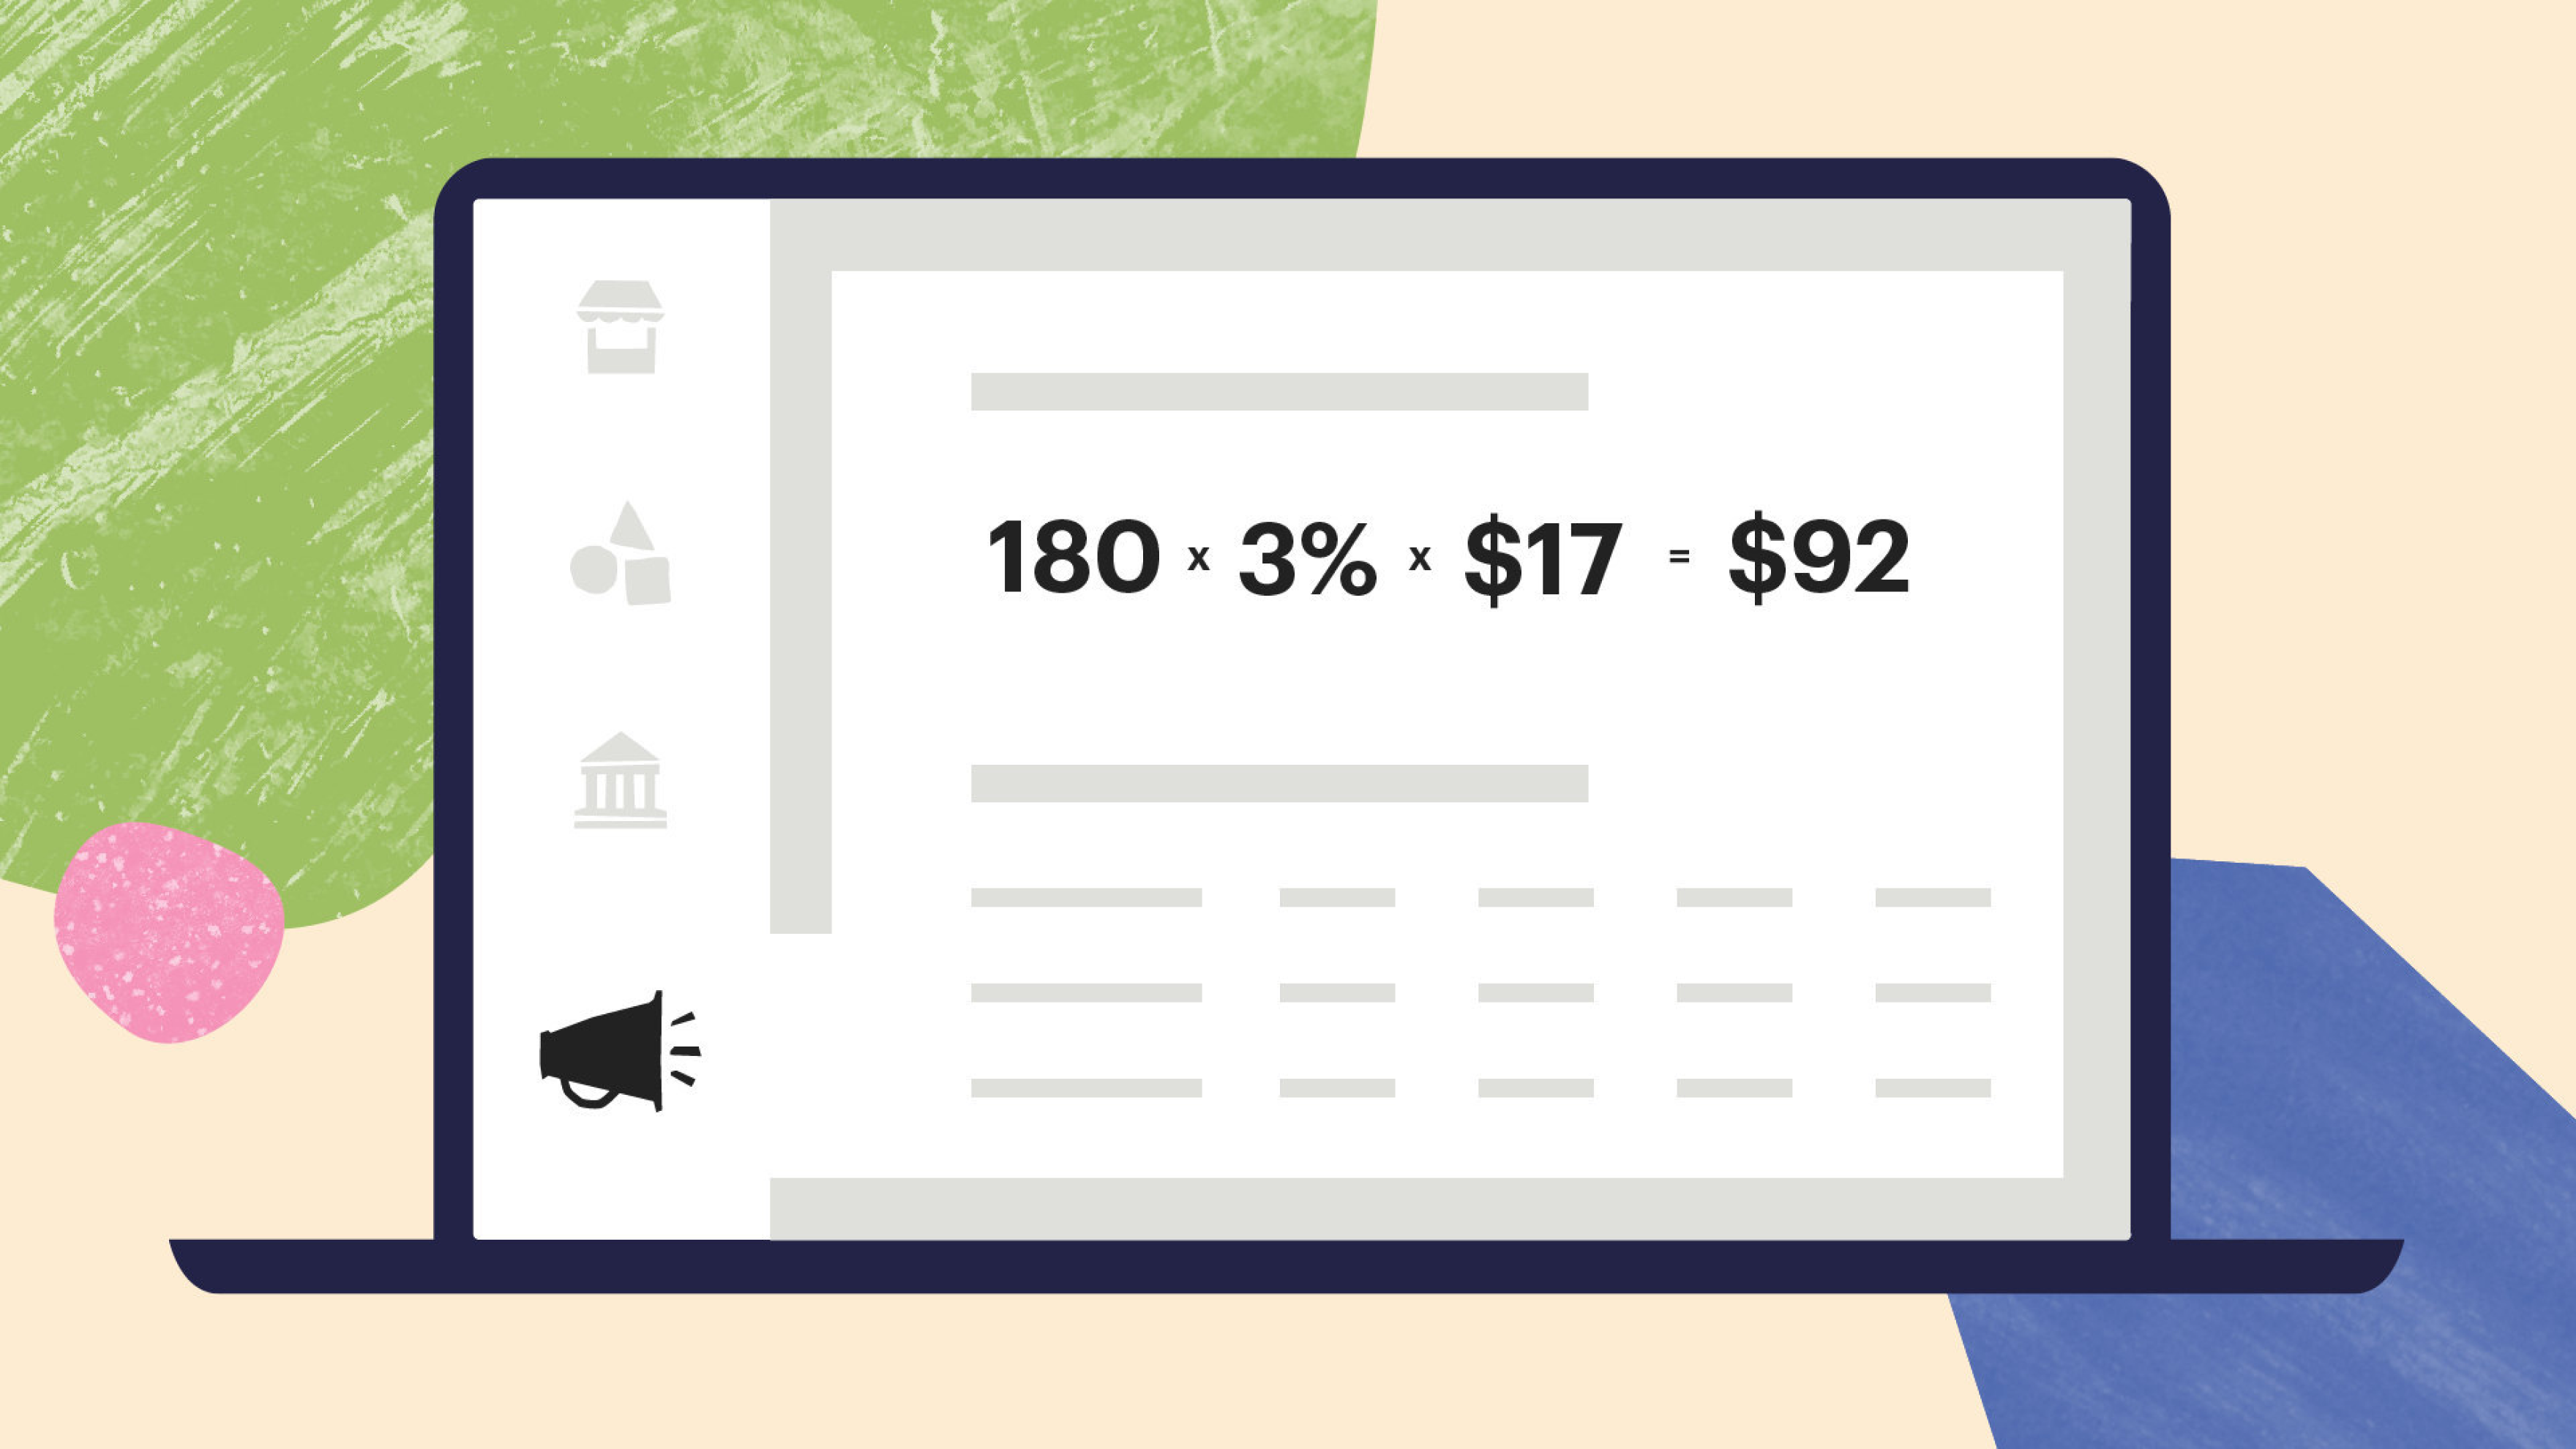
We decided it would be beneficial to use this update as an opportunity to highlight the four numbers that matter to a shop: visits, conversion rate, average order value, and revenue. Sellers better understood what drove buyers to their shop when they saw this data laid out as a formula.
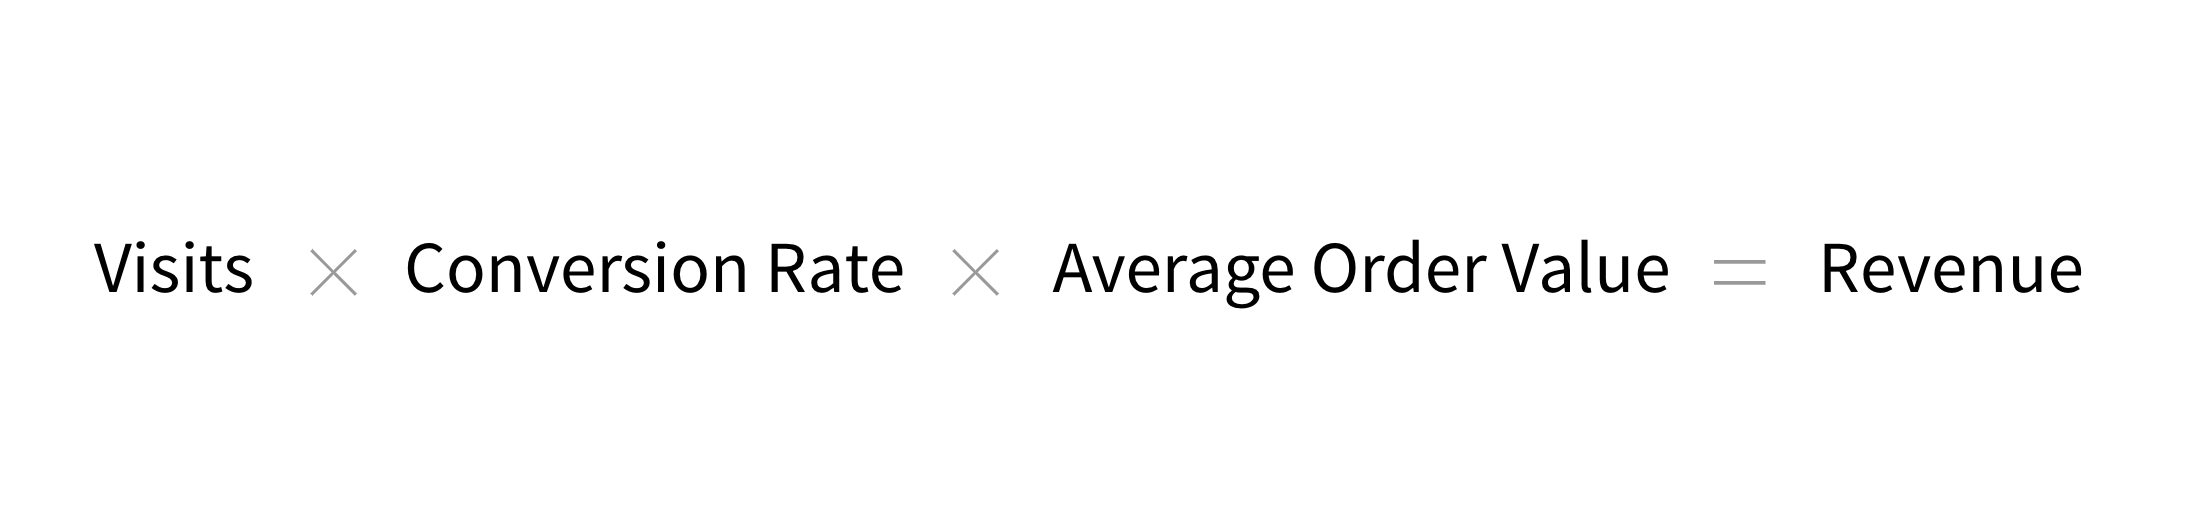 Etsy uses this formula to calculate gross merchandise sales. Why not show it to sellers?
Alignment
After that user research, I organized an ideation exercise to assess the needs of sellers with lots of people in different roles from across the company. This was to fill in gaps caused by being short-staffed. I hoped to court anyone, especially engineers who might be interested in joining the team.
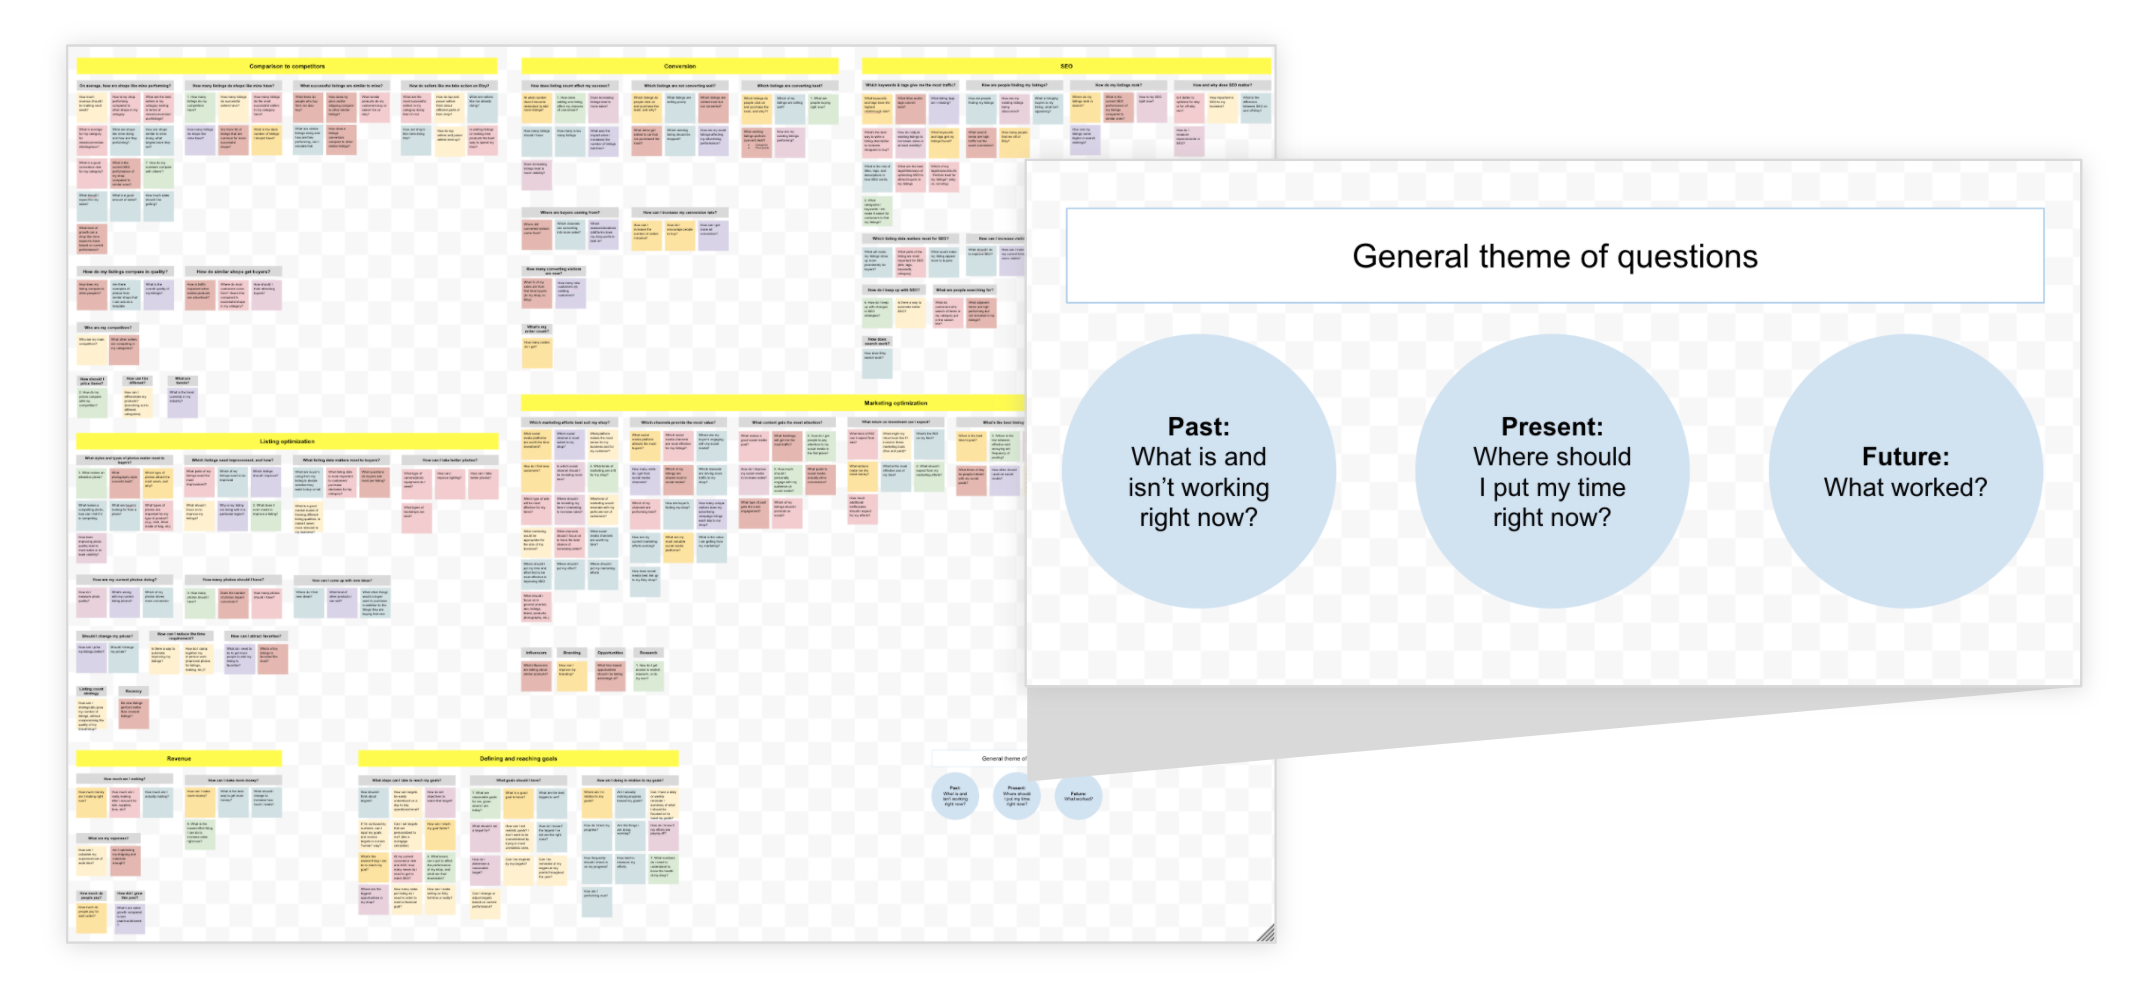 Digital stickies I organized after the ideation exercise to assess seller needs.
I spent at least 5 hours parsing the outputs of that ideation exercise. We learned that there were three themes of questions sellers ask:
- What’s successful (or not working well) about my shop?
- What should I focus energy on improving right now?
- What’s the impact of actions I took to improve my shop?
Discovery research also showed that sellers were still reeling from the major relaunch in 2017. The major reason was that data available in the relaunched Stats didn’t answer the above questions. Worse off, the backend was not built to support the depth of information necessary to answer those questions. This is partially because Etsy’s definitions of industry standard terms (such as “visits”) weren’t aligned—for example, sellers used other sites like Google Analytics and were confused when Etsy’s numbers were different.
Shop stats wasn’t doing a good job, and the team wanted the product to eventually be a source of truth. So, we decided that the best way forward would rebuild Etsy’s stats from the ground-up… again. The team decided to call the new product “Analytics” to differentiate it from the product sellers hated.
Ideation
I made lots of diagrams and prototypes to get divergent with my thinking. The aim was to imagine some of the many possible futures in which sellers could get the information they needed. This helped us understand the layers of data necessary to answer sellers’ questions.
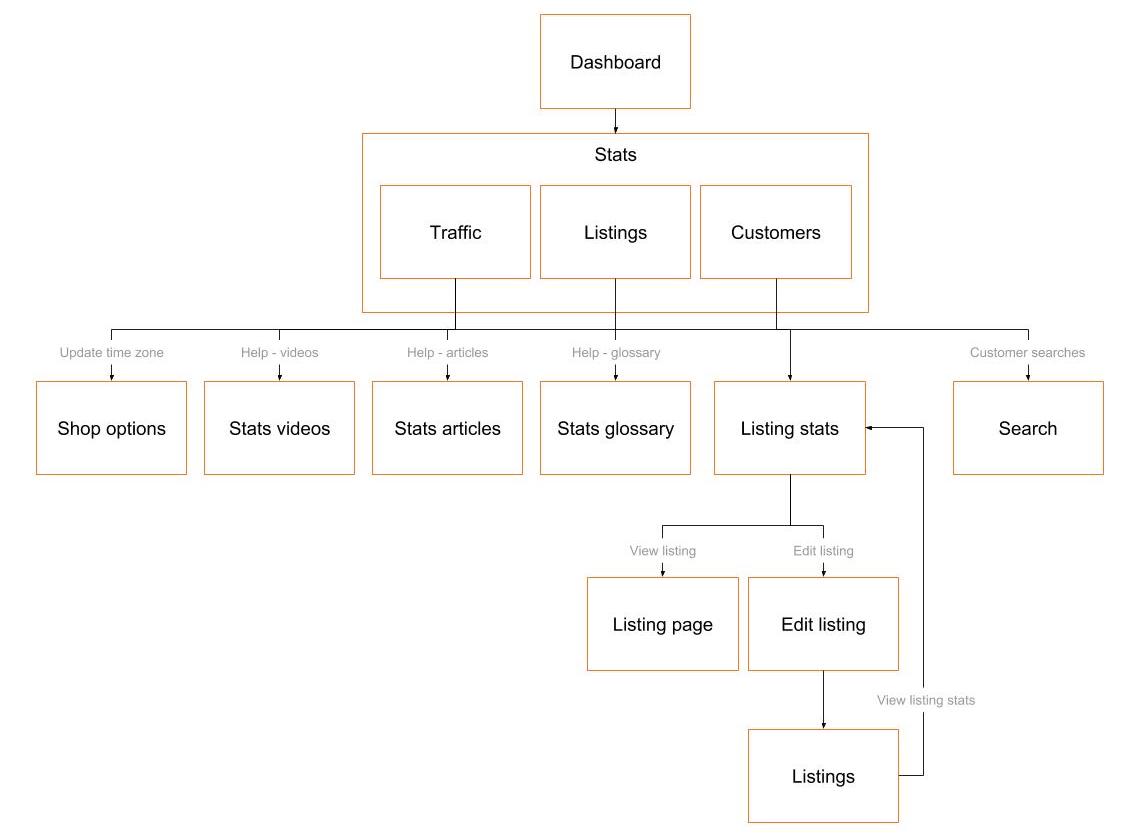 User flow diagram of the existing Stats product architecture.
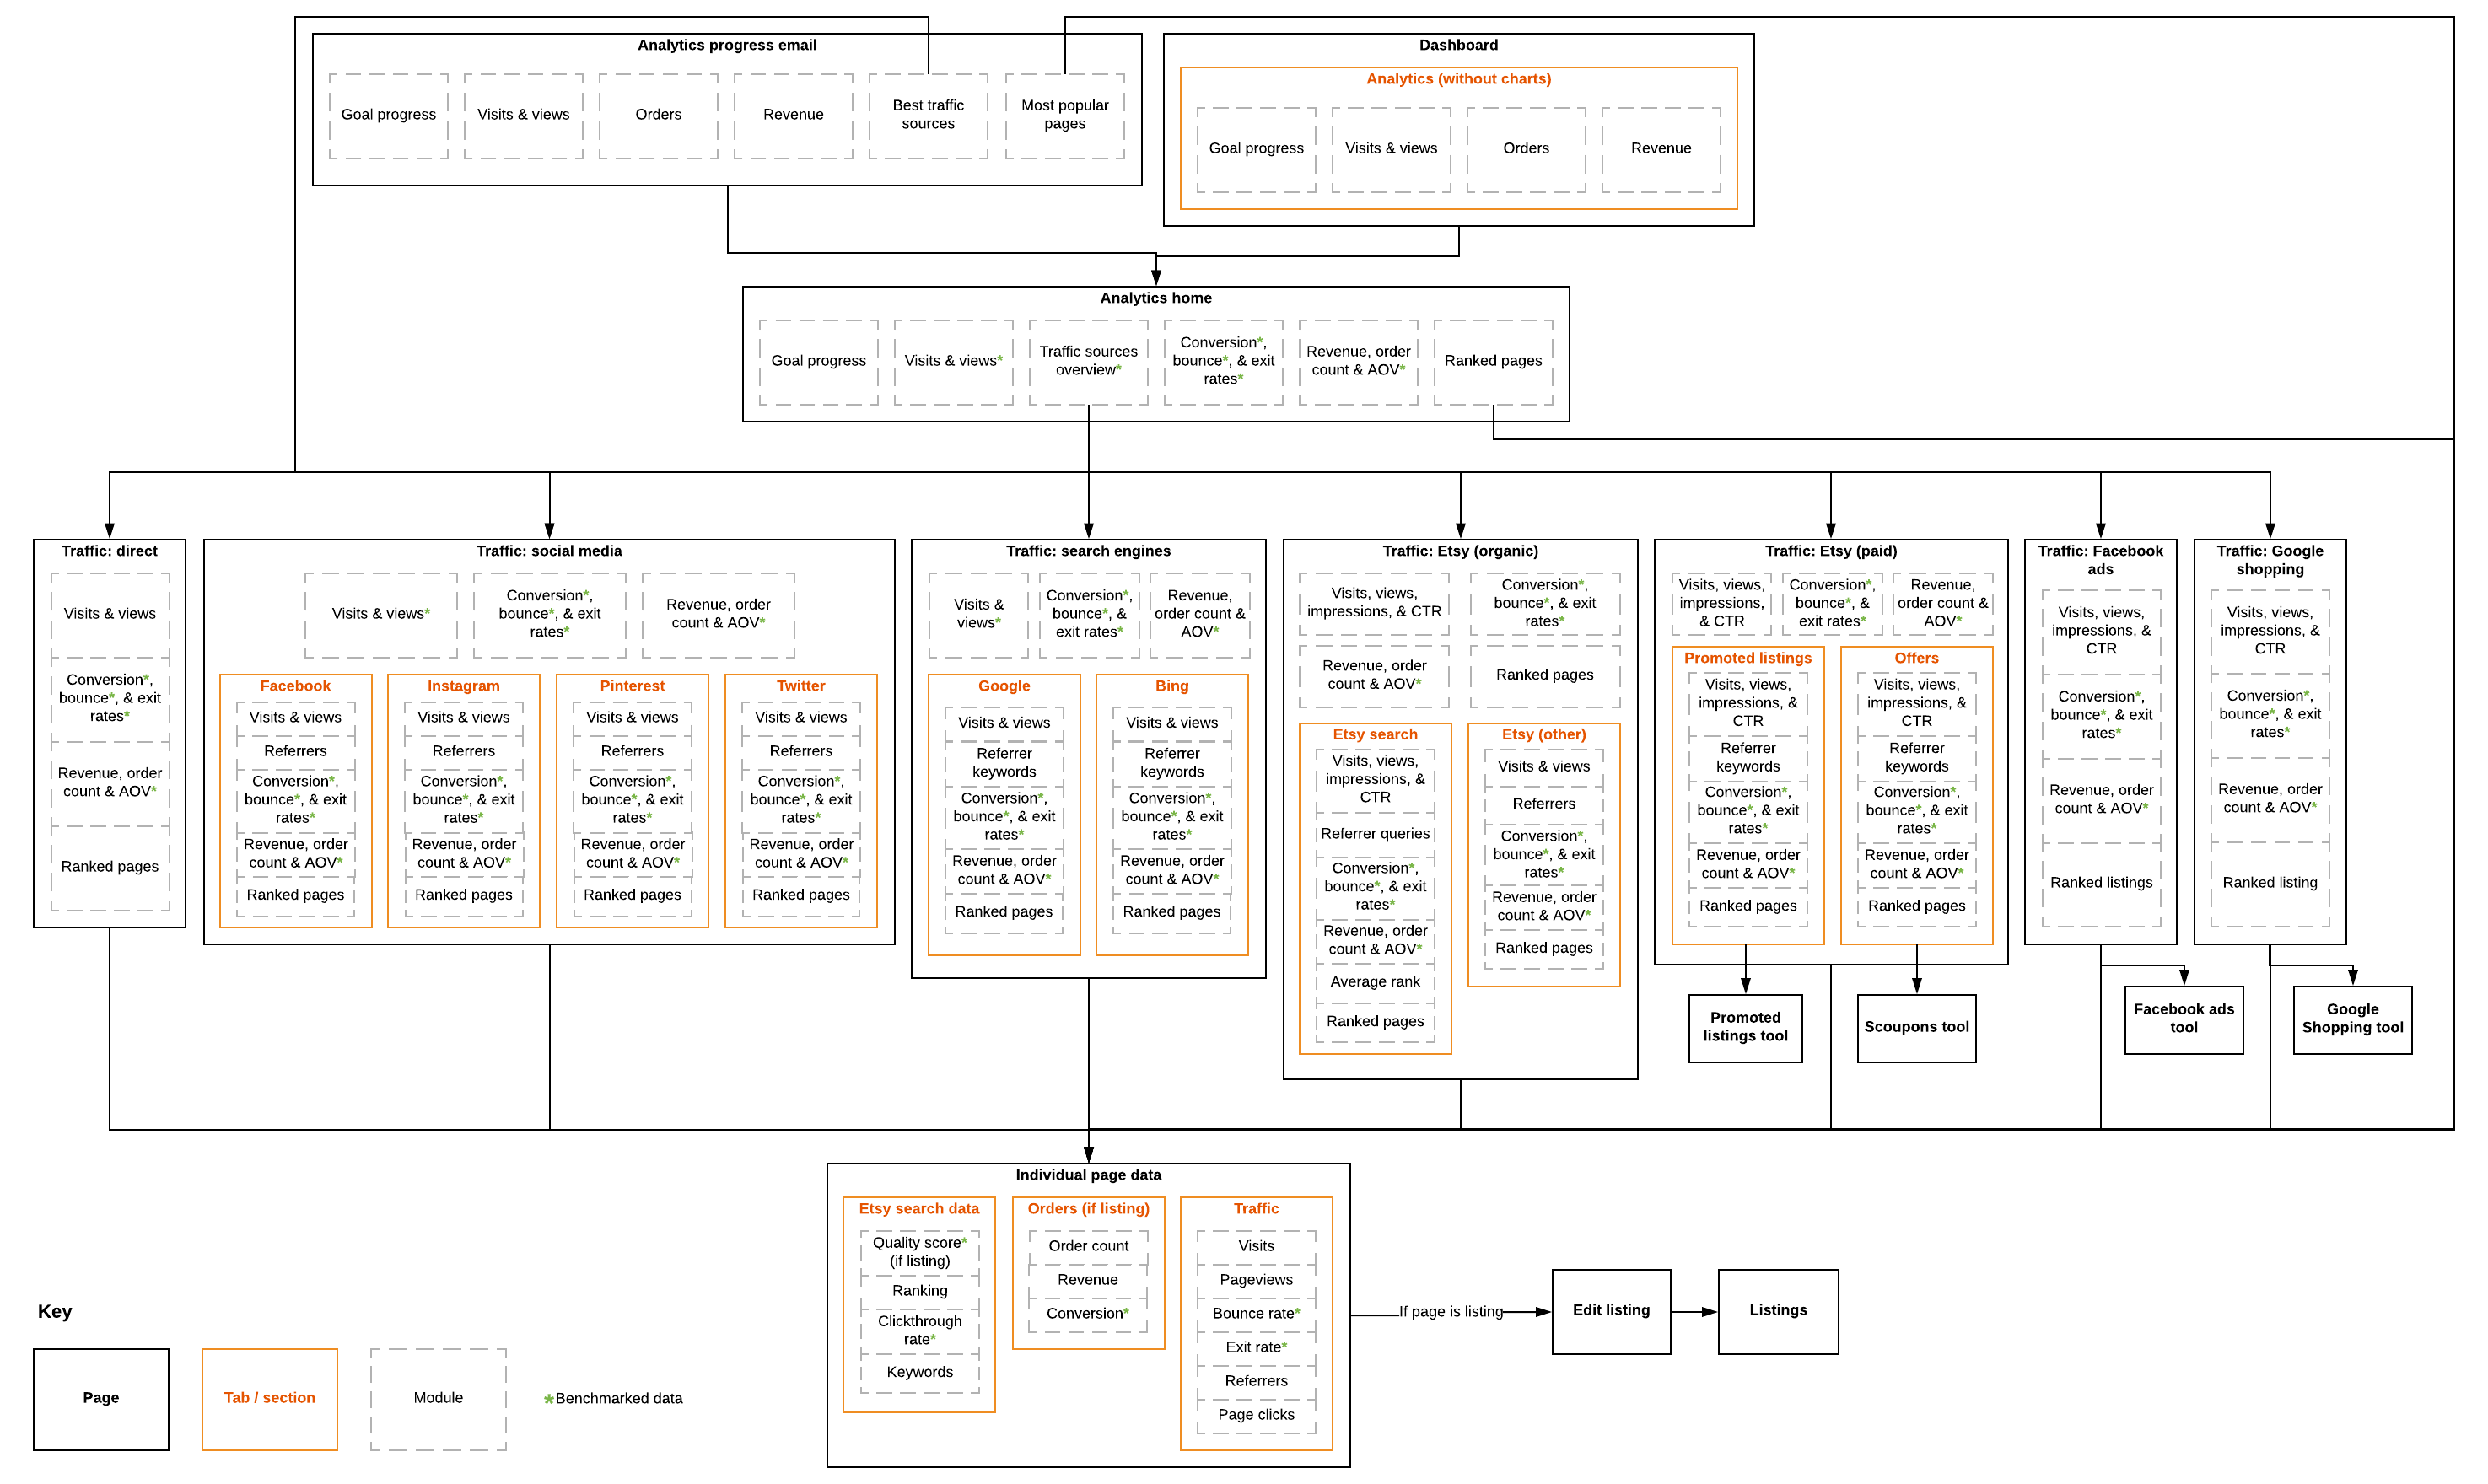 Proposed new user flow.
 Clickable prototype of long-term design vision on mobile.
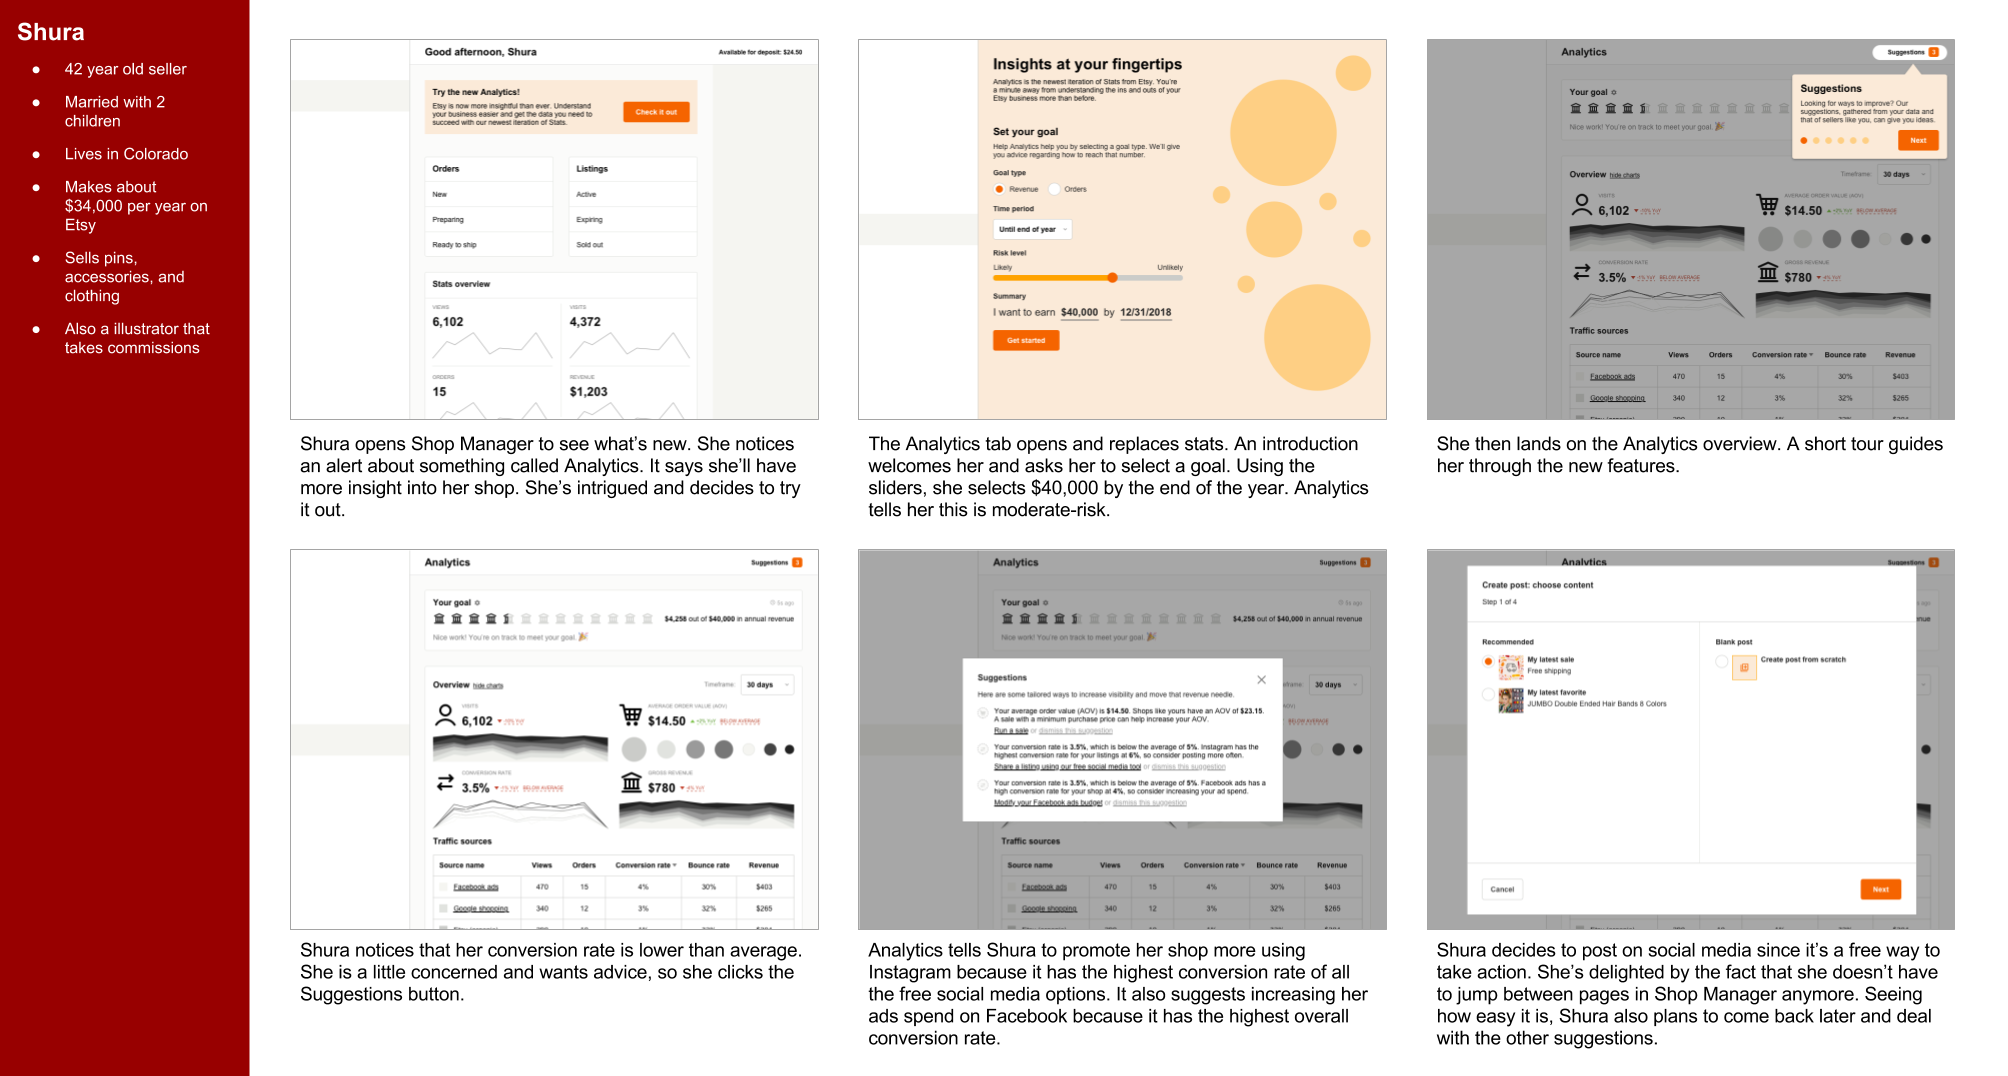 A scenario illustrating the vision for how a seller would onboard to this experience via web.
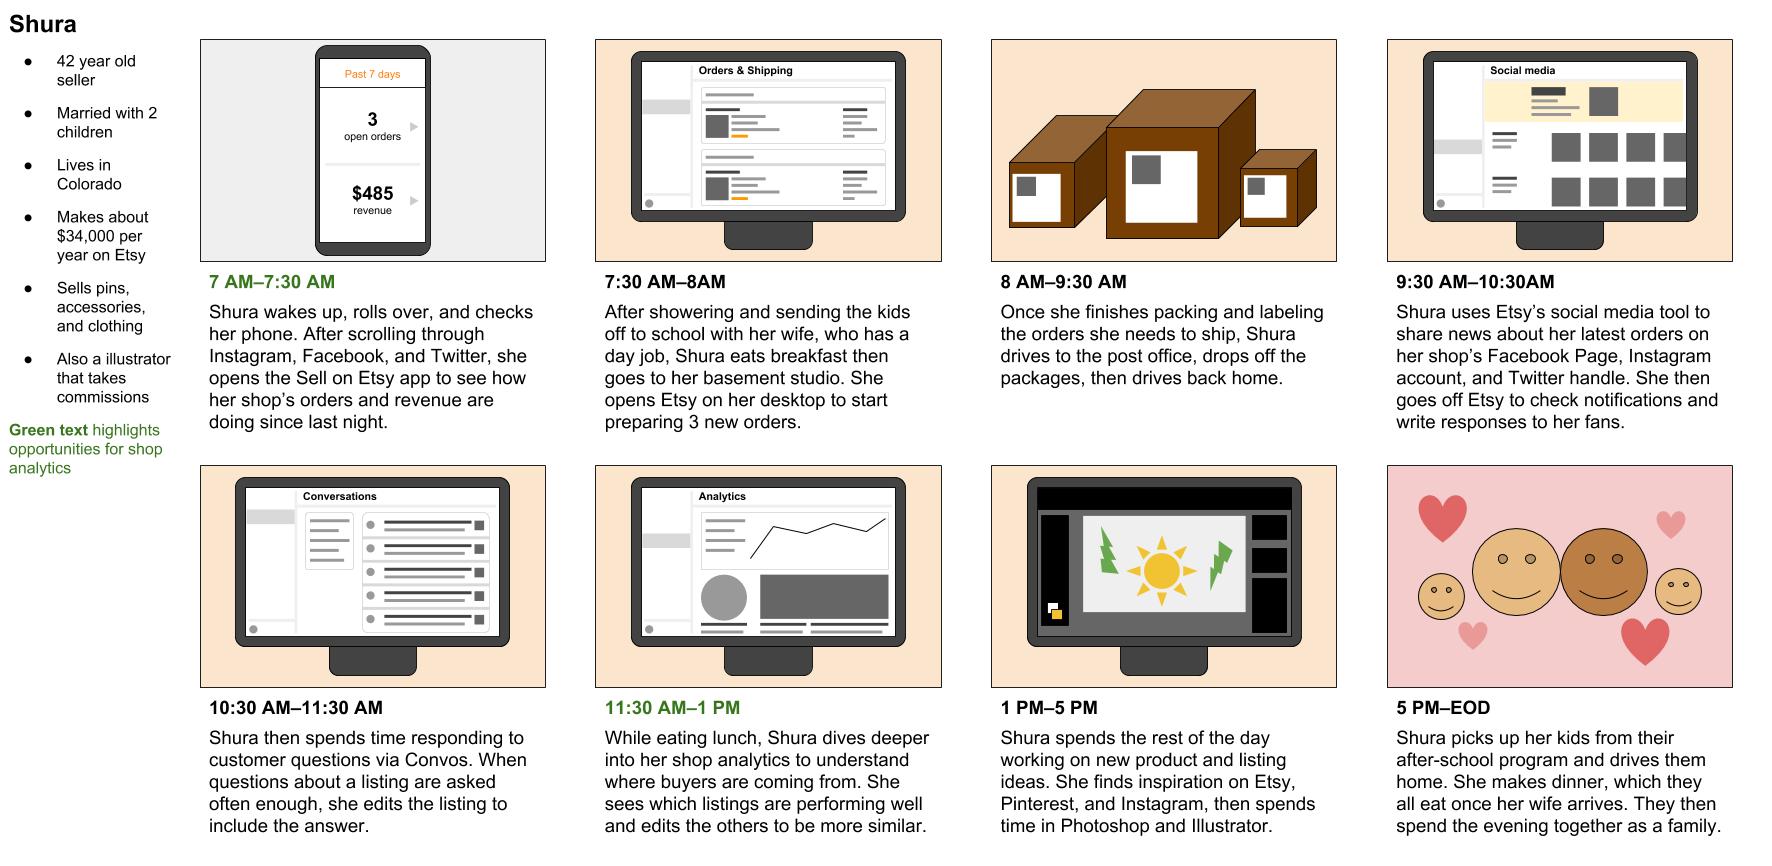 A scenario showing how Shop Analytics would fit into the seller’s shop management process.
Constraints
We knew a full rewrite would take a while to build, so we needed to form an opinion about which layer of data to start with. Engineering headcount was low, hiring was progressing slowly, and rebuilding the entire data model would take years. We decided to start at the lowest layer and work our way up; our engineering manager recommended this approach because it was easiest to build.
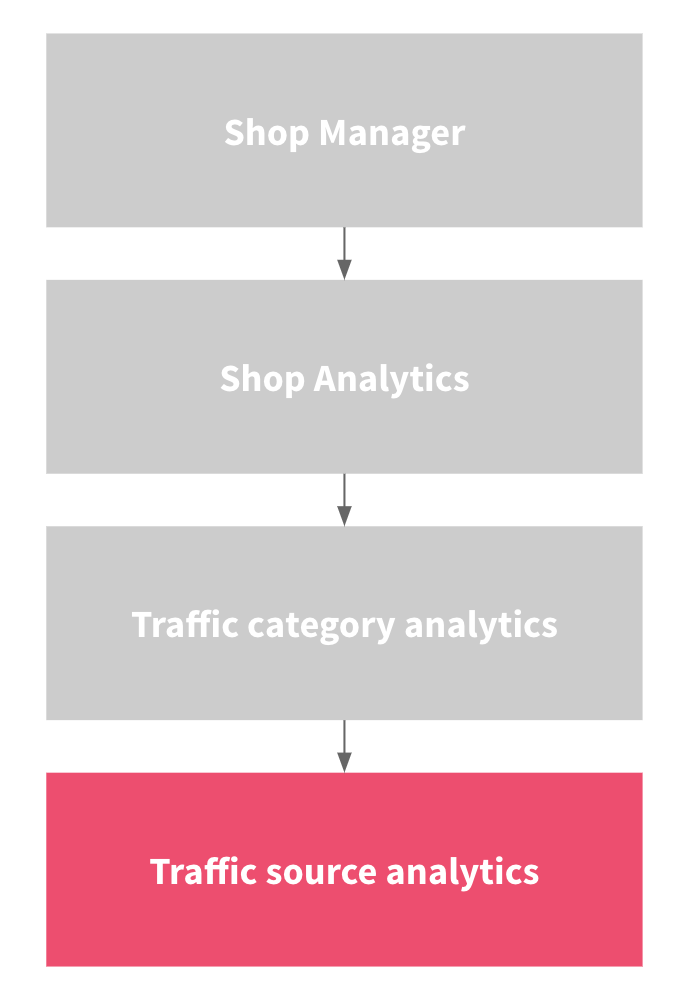 A simple version of the proposed user flow. Pink shows the layer at which we started.
The piecemeal approach would allow us to test and iterate. At the time, there weren’t any clear cons to this approach so we moved forward.
Narrowing focus
Through the research, I learned that sellers were extremely confused about how buyers found their shops on Etsy. So, we decided to focus on demystifying Etsy search data. Many sellers described Etsy search as a black box, and our goal became to help equip sellers with the confidence to get their items found by buyers on Etsy.
Prototyping
Conducting research for this product was complex because we needed to make the environment believable in order to get reliable feedback. I hand-coded prototypes to test with sellers since we were still waiting for engineers to join the team. These prototypes included a mixture of their real data and hypothetical numbers I calculated in a spreadsheet based on their data.
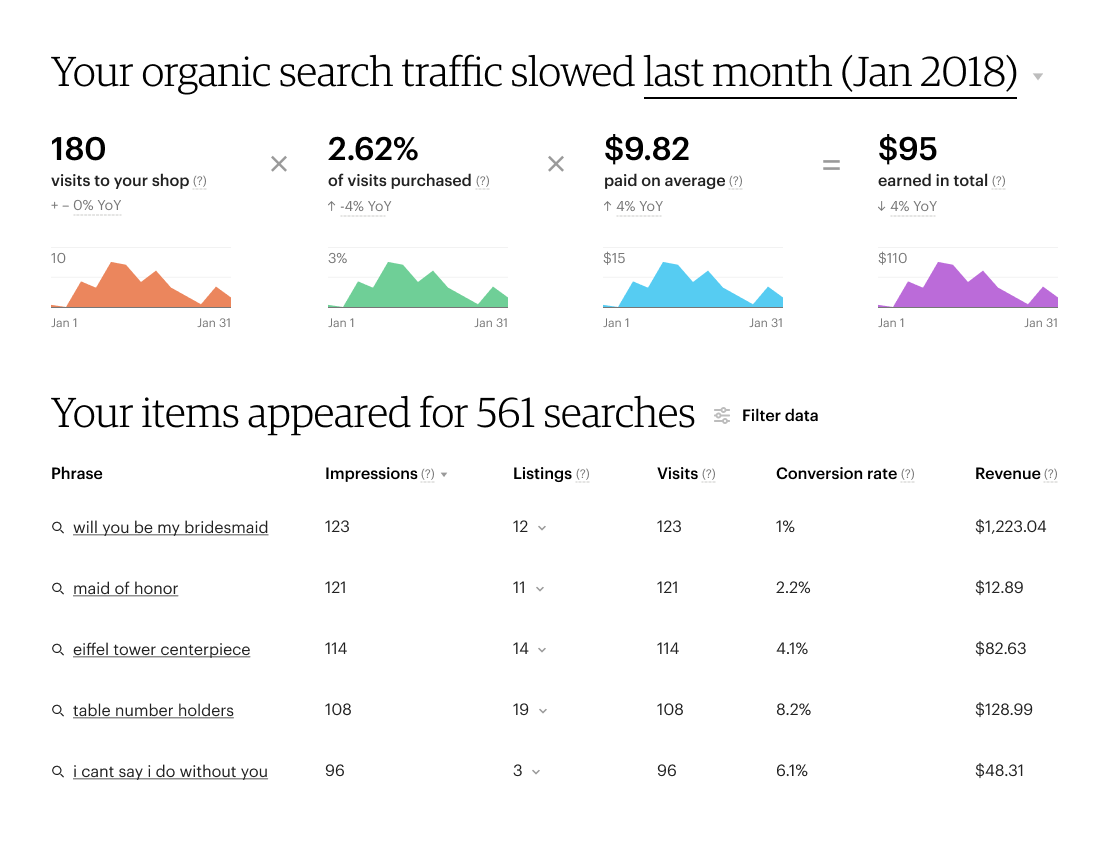
 A Search Analytics prototype I built for research.
 A mockup from a clickable prototype with charts.
Based on my research, I learned that deep analytics for Etsy search was a compelling product offering. Sellers react emotionally to data, especially when it’s mixed with colors to denote positive and negative movement.
MVP
In May 2018, six months after the project began, four engineers and a full-time Product Manager joined the team. Management told us to launch the product by September of the same year, meaning the engineers had four months to build a new architecture and a frontend for Search Analytics. We had to cut engineering costs, and the first thing to go was recommendations. I narrowed the user experience down until it was a scope we could execute within that time period.
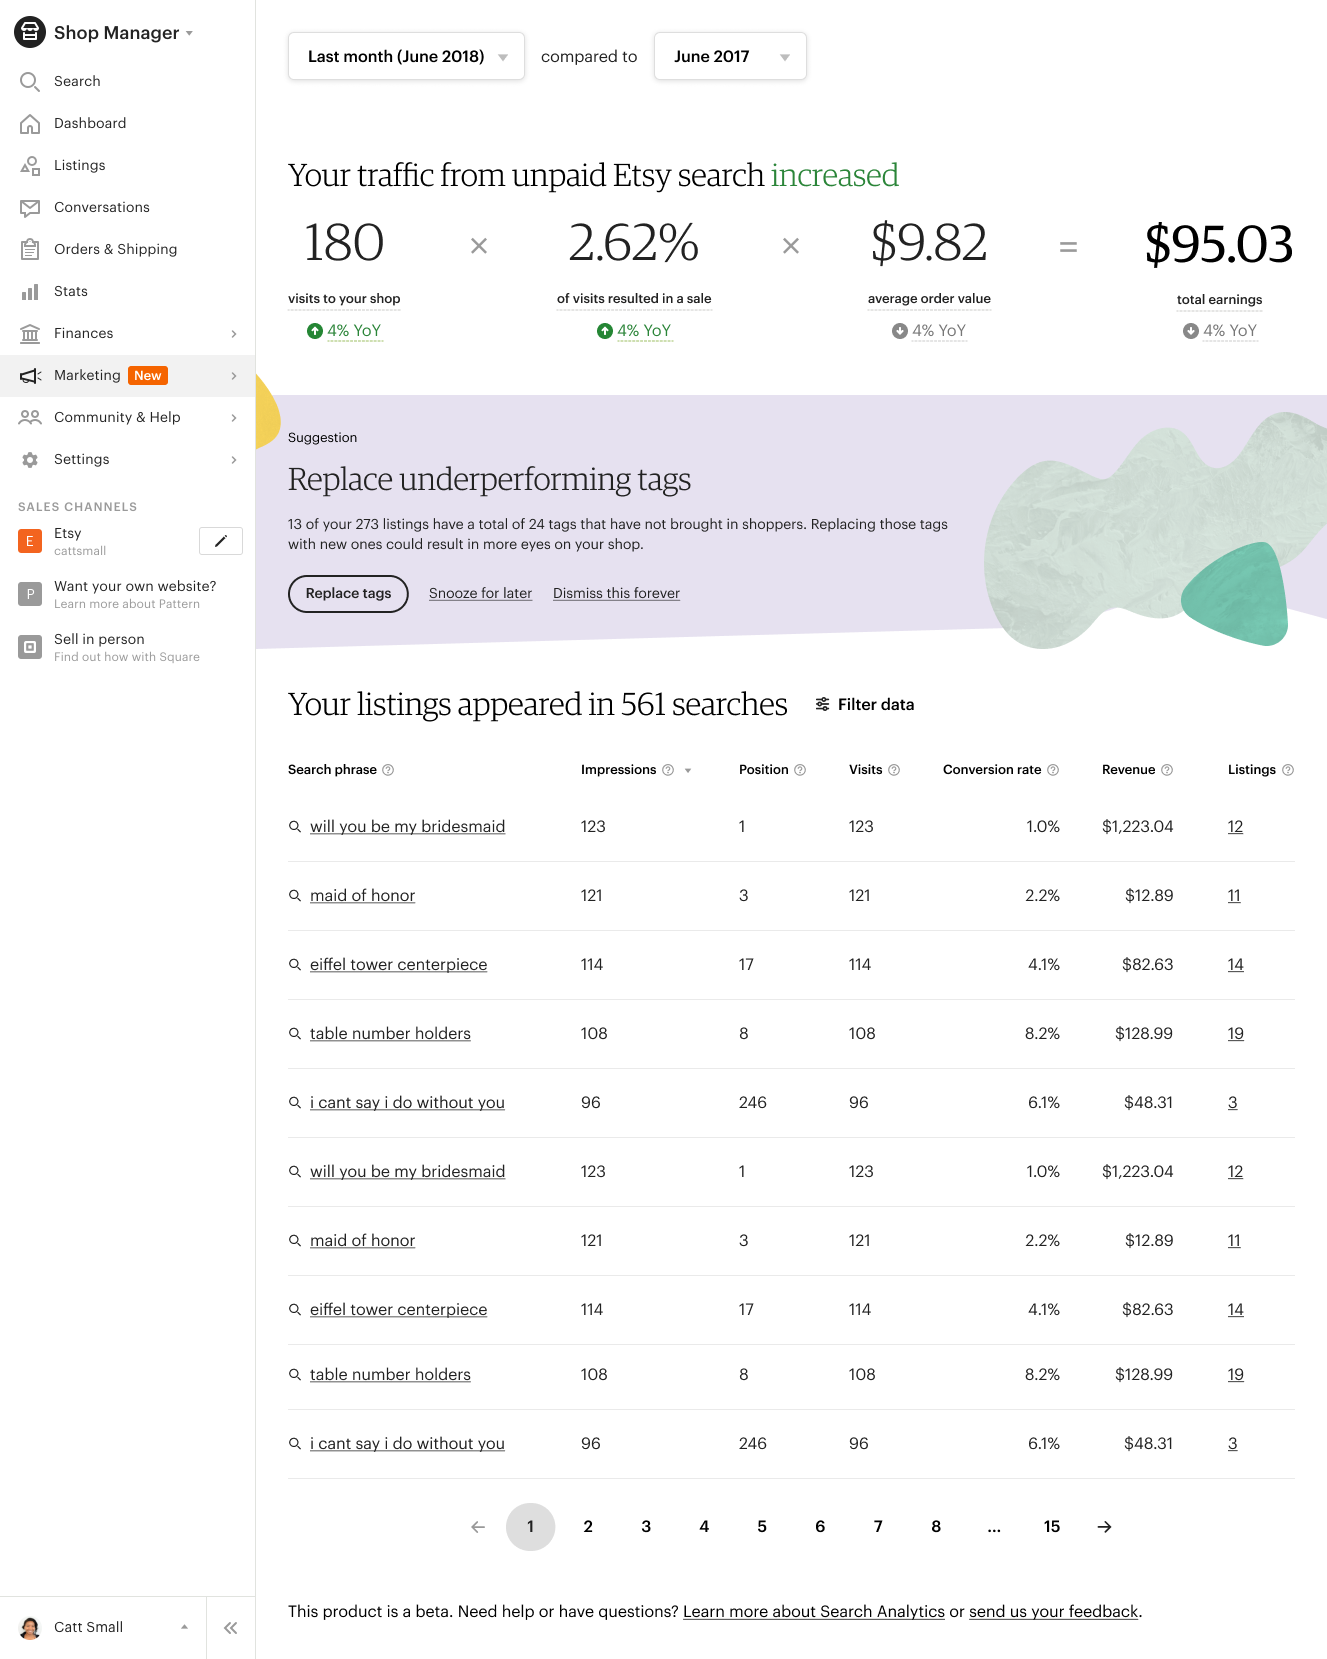
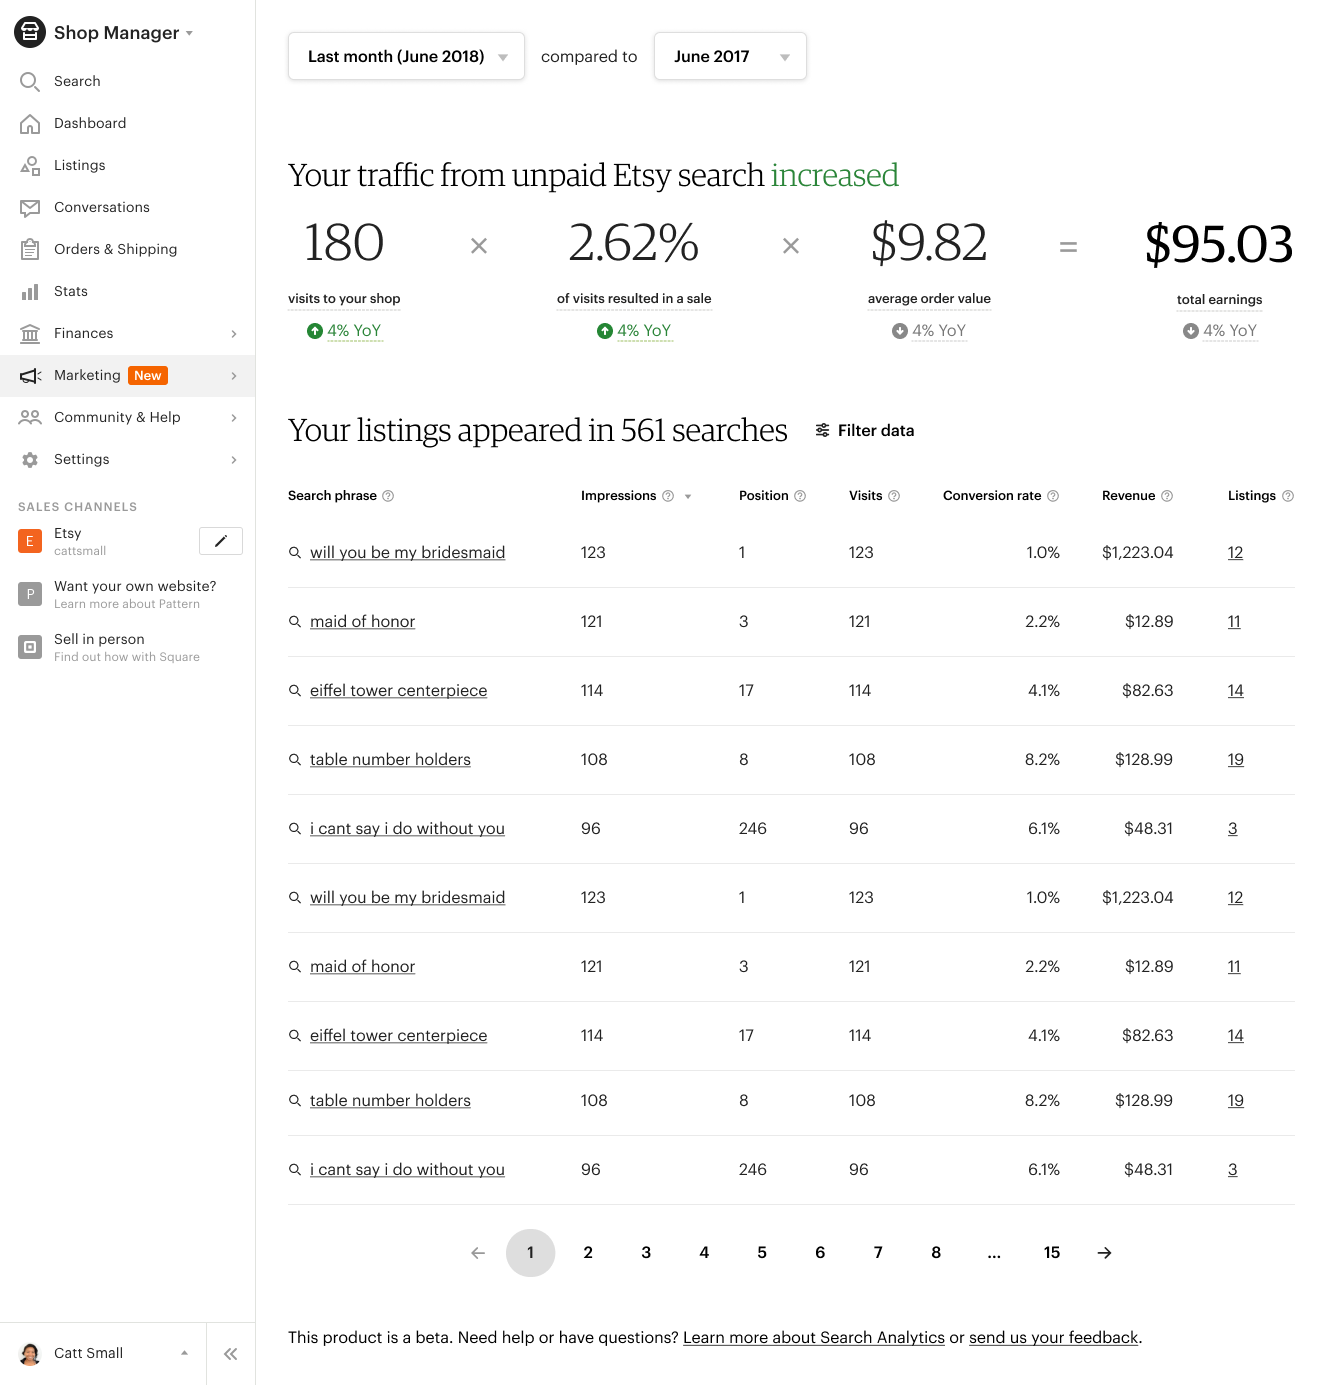 The final MVP design for Search Analytics.
Shop advice
Research told us sellers weren’t sure how to use Analytics data without suggestions and benchmarks to show what and how well they should be doing. While the team built out Search Analytics, I collaborated with my user researcher and PM to conduct a Wizard of Oz study to understand the kinds of recommendations sellers needed. We sent ten sellers a weekly email containing hand-calculated data and custom suggestions. Sellers submitted feedback through a survey. The study was four weeks long.
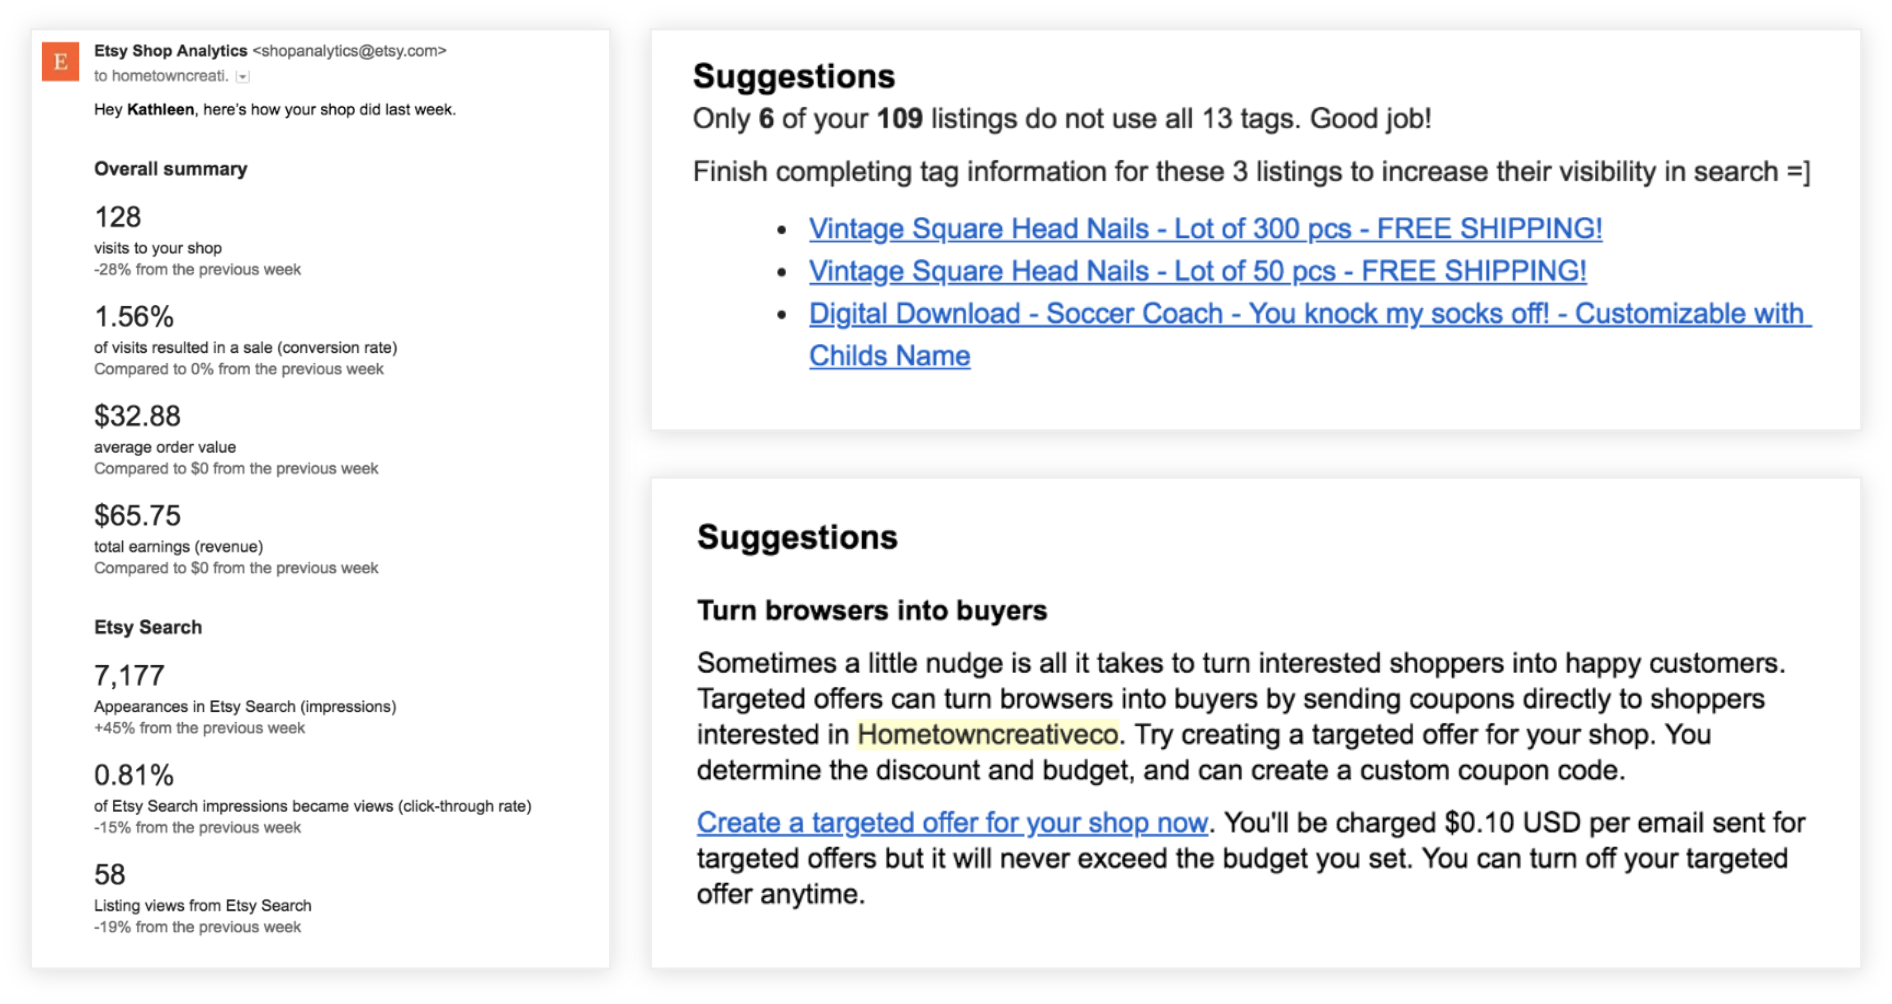 Screenshots of the email research.
We found that sellers are motivated by new insights and personalized actions, especially when received in a comprehensible format. Sellers told us they needed advice that was as specific and actionable as possible. They once again needed to know what the return on investment would be from paid suggestions. I advocated for us to prioritize this feature in a future launch, as it was clearly valuable to sellers.
 A potential placement for recommendations.
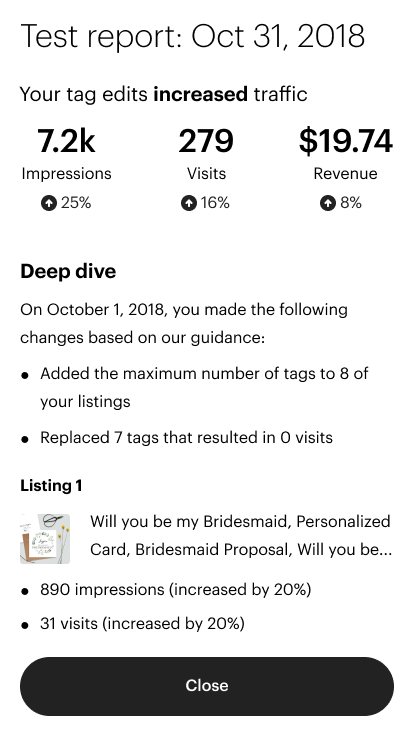
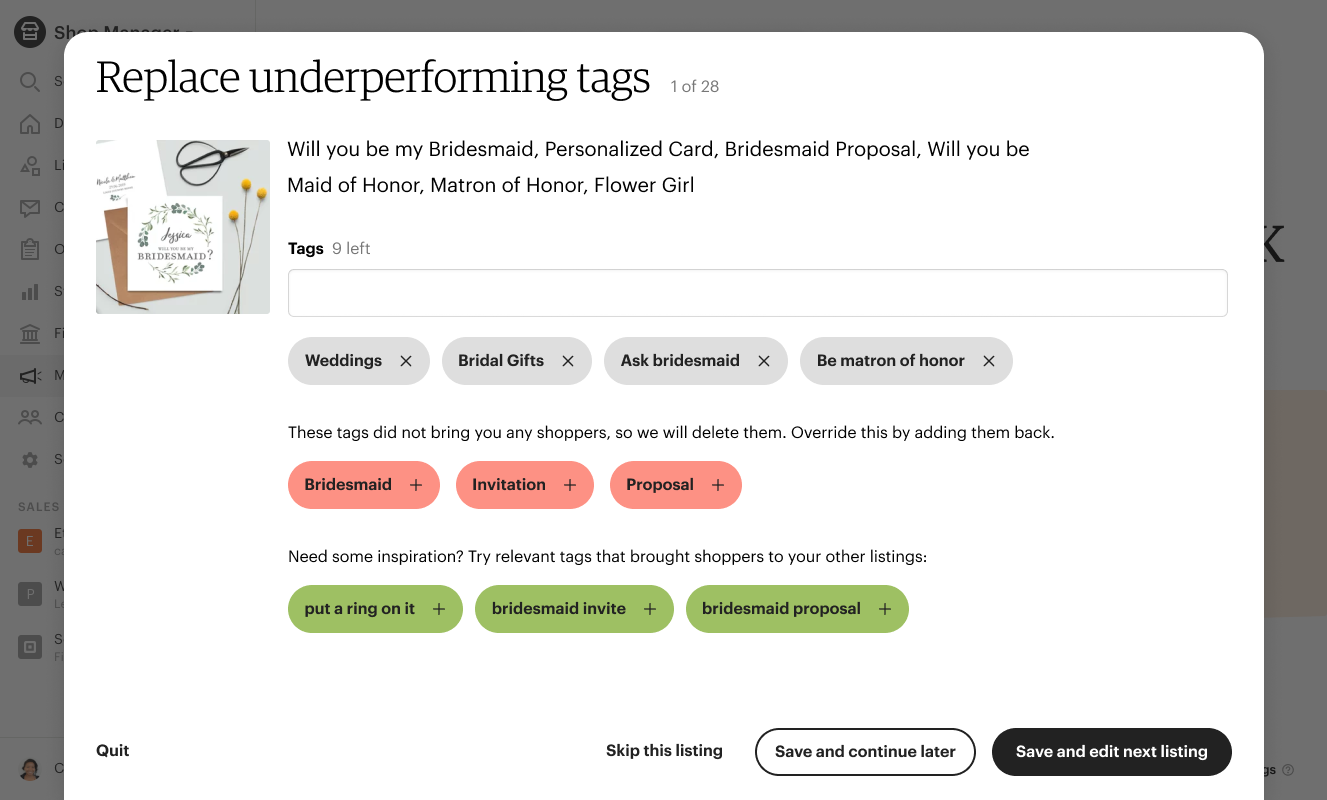 An example of how we might provide actionable advice.
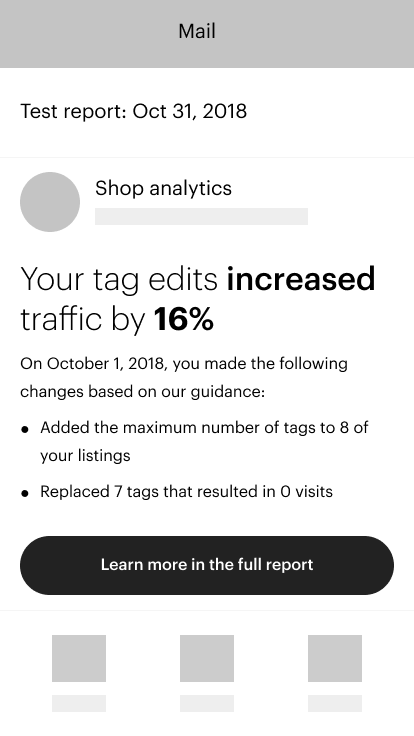 Email report wireframe.
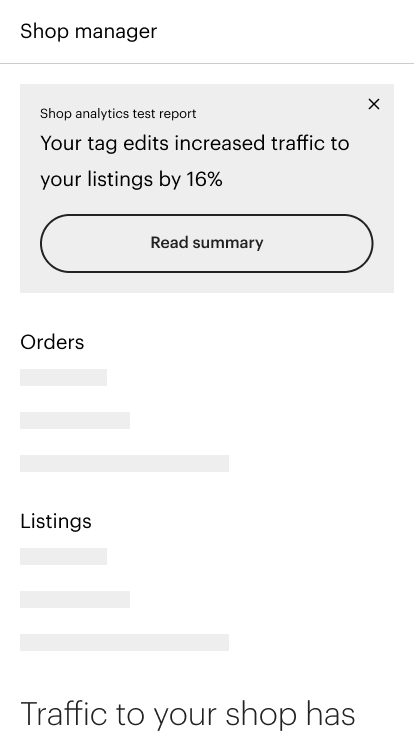 Report in shop manager.
 Report in Shop Analytics.
Build
As engineering began crafting the MVP, we quickly realized some decisions that seemed fine in abstract weren’t great in reality. First of all, the second version of Etsy’s design system wasn’t code-complete at this point. Typography styles were complete and usable, but other more complicated components had yet to be ported into React.
I needed to compromise in several ways so we could launch on time. The most painful example was the decision to use an older version of tables instead of the new one I designed for Etsy’s design system. This was done in order to launch by September; our engineering team didn’t have the capacity to help implement React tables in the design system.
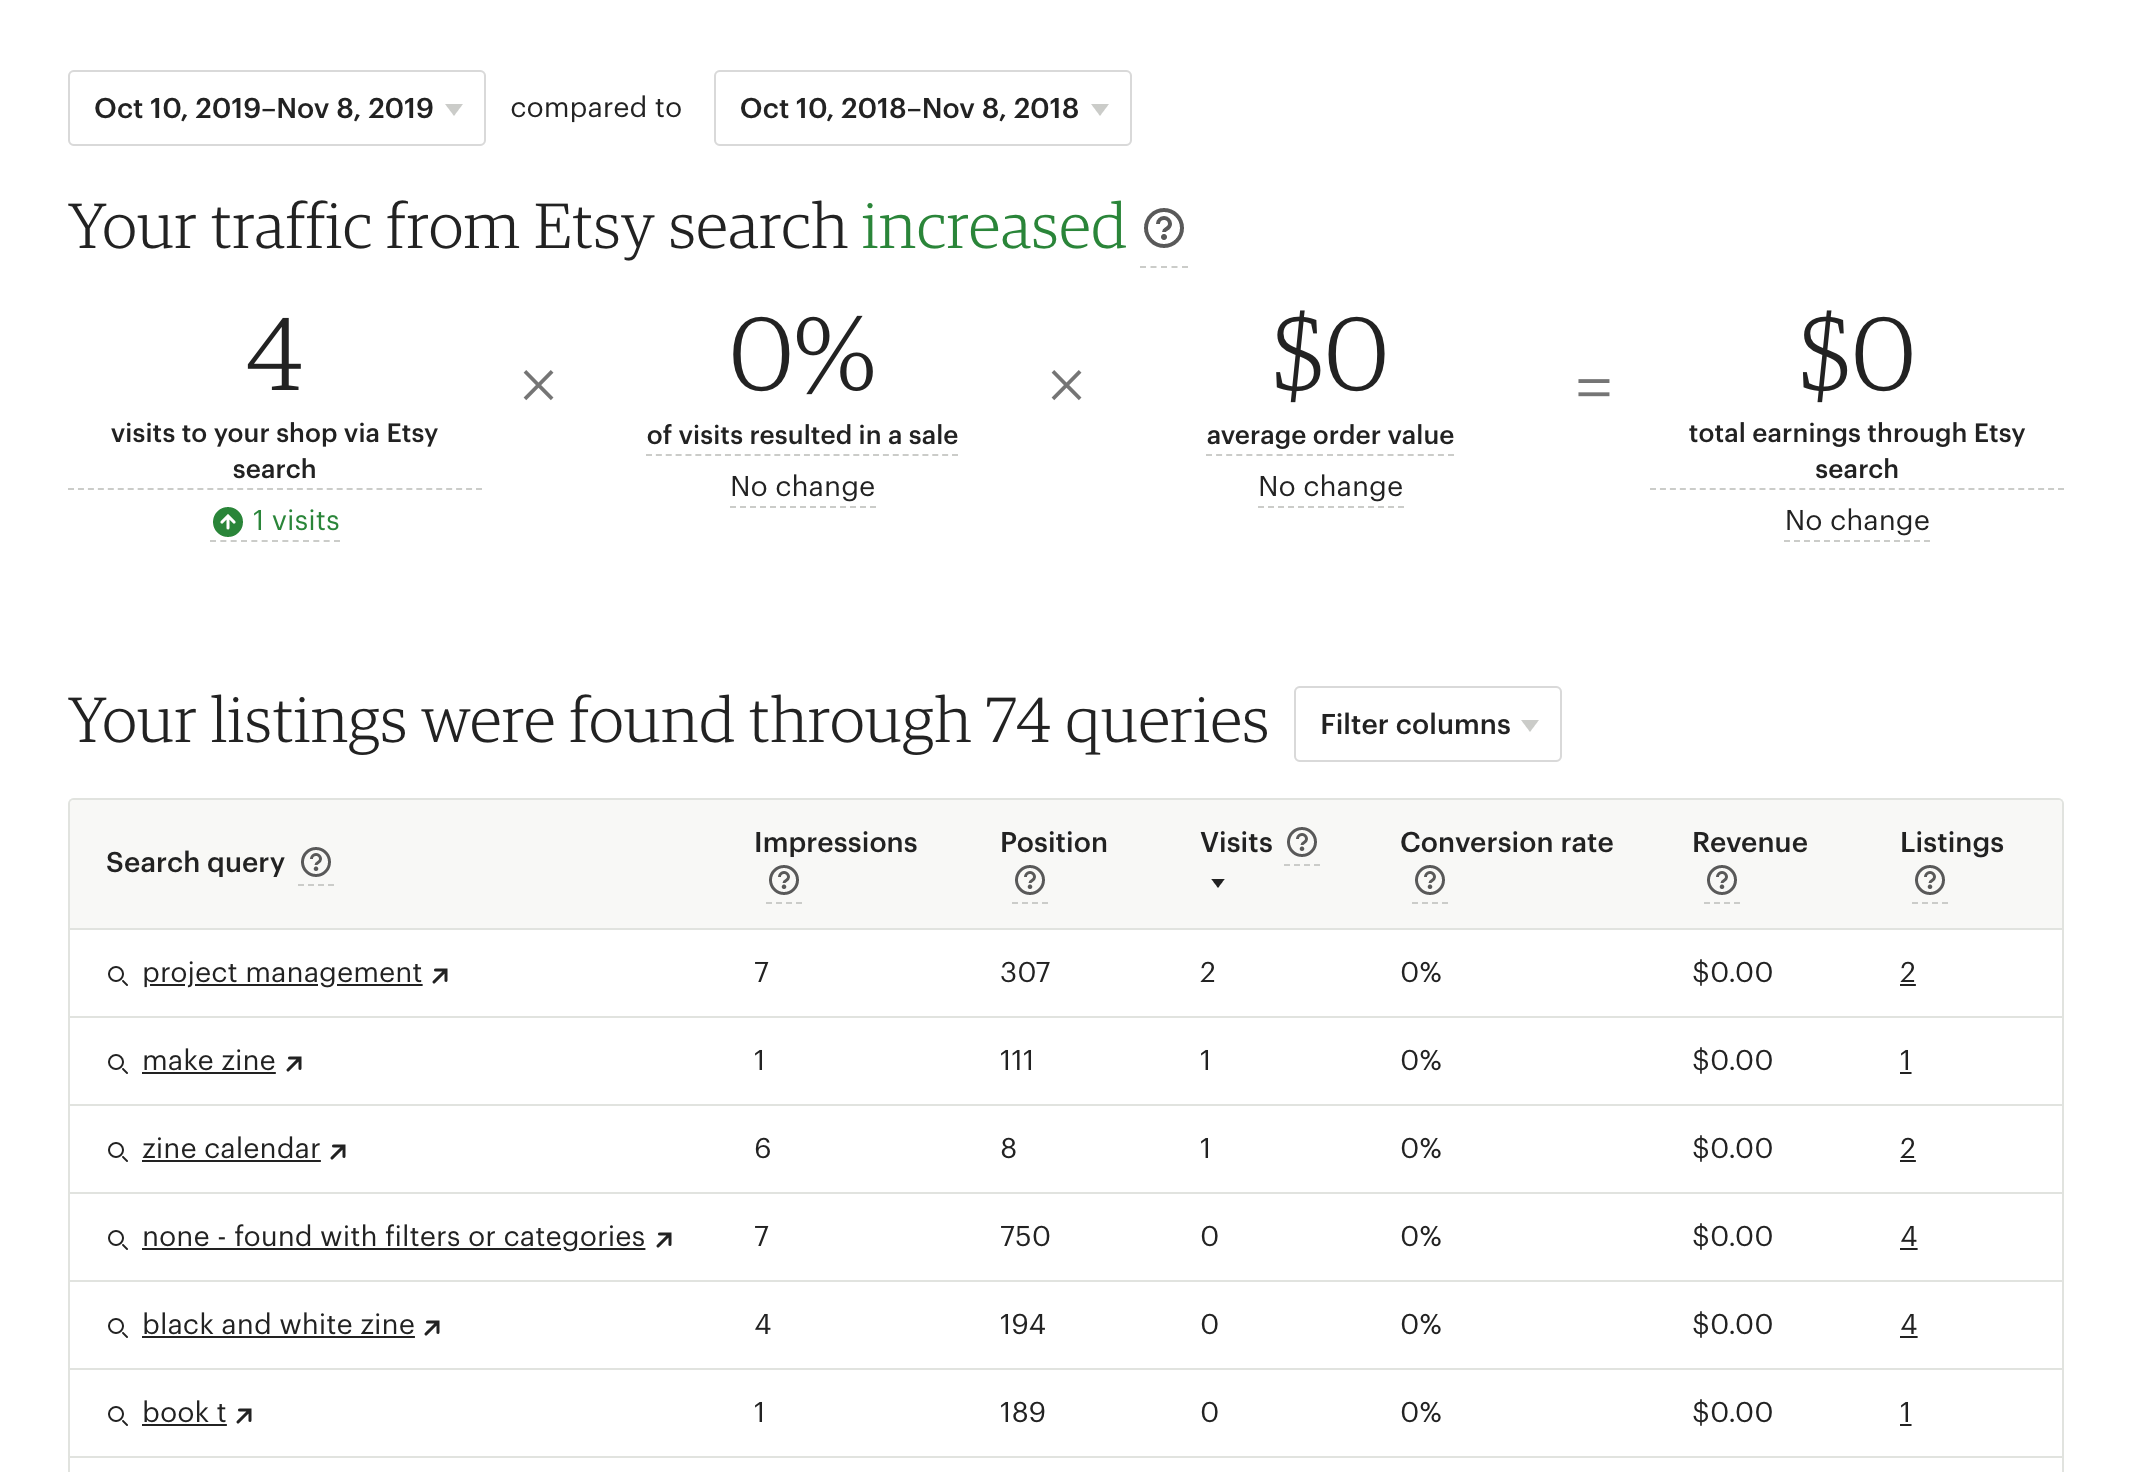 The live design in 2018.
Much worse, however, was that the numbers didn’t match. There was a discrepancy between data points (such as visits) in the existing Stats product versus the new one. The existing data didn’t match our new calculations. This drawback was not clear when we began scoping the project because we didn’t have full-time engineers, but it was very obvious in-product.
Due to these issues, my PM decided to keep the existing Stats where it was and launch Search Analytics in a different area under the Marketing tab. This would mean sellers would be able to see both sets of numbers in different parts of Shop Manager. I strongly recommended against this several times and pulled in Etsy’s Staff Information Architect for support in advising against this decision.
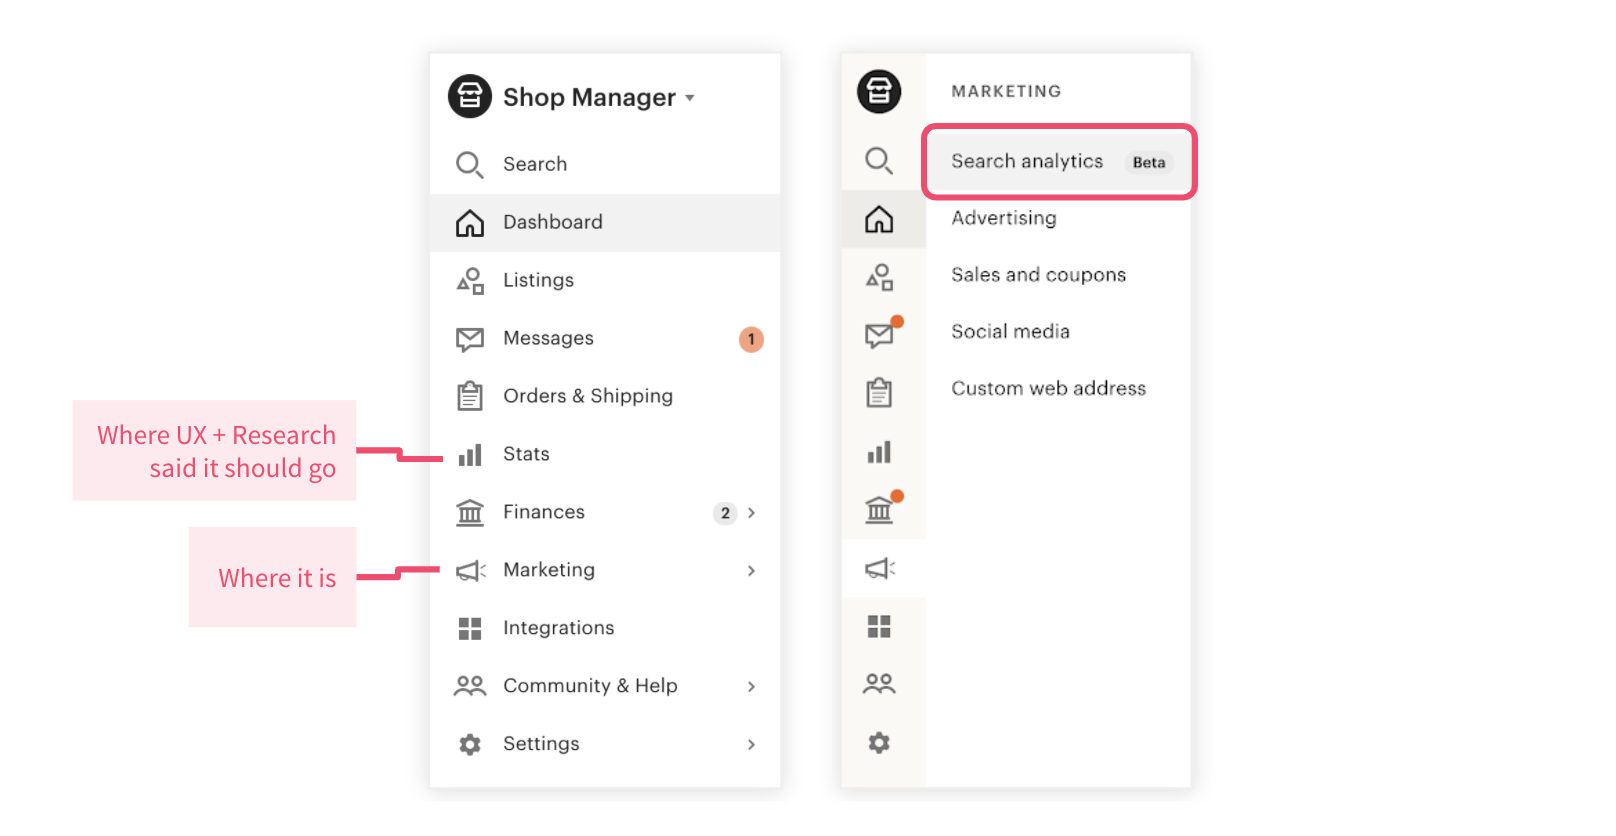 We disagreed about where to place Search Analytics in the product.
Based on the research, I knew we were good on the basics but had no idea how this product would work in the wild. The aforementioned pitfalls made me extremely concerned. I repeatedly recommended we do a beta test before publicly releasing the product.
My new PM felt pressure to deliver on expectations set by leadership. If we were to launch on time, it was assumed that we didn’t have the capacity for a beta test. It was clear that we needed to move forward, so I eventually acquiesced and we decided to launch the way my PM intended.
Launch
We did an initial rollout in September of 2018. Unfortunately, there were several breaking bugs that caused the team to roll back the product several times. The product finally rolled out to 100% of sellers in October.
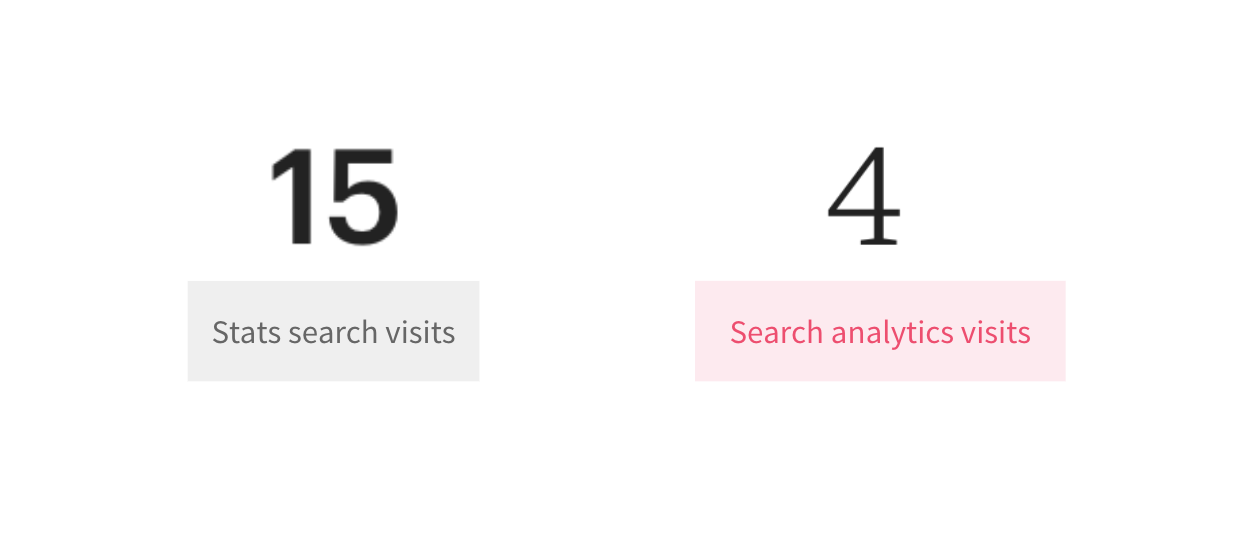
In its first full active month, the product was used by 205,000 sellers (about 10% of sellers on the platform). 41,000 sellers used it on November 1 alone. My information architecture hypothesis was likely correct—sellers didn’t know how to find the page after using it the first time.
We included a survey on the page to get feedback from sellers about the new experience. Results were across the board. Only 38% of users found it easy or very easy to use the page to make decisions about their shop. That means 62% of surveyed sellers who used Shop Analytics didn’t find it useful for decision-making.
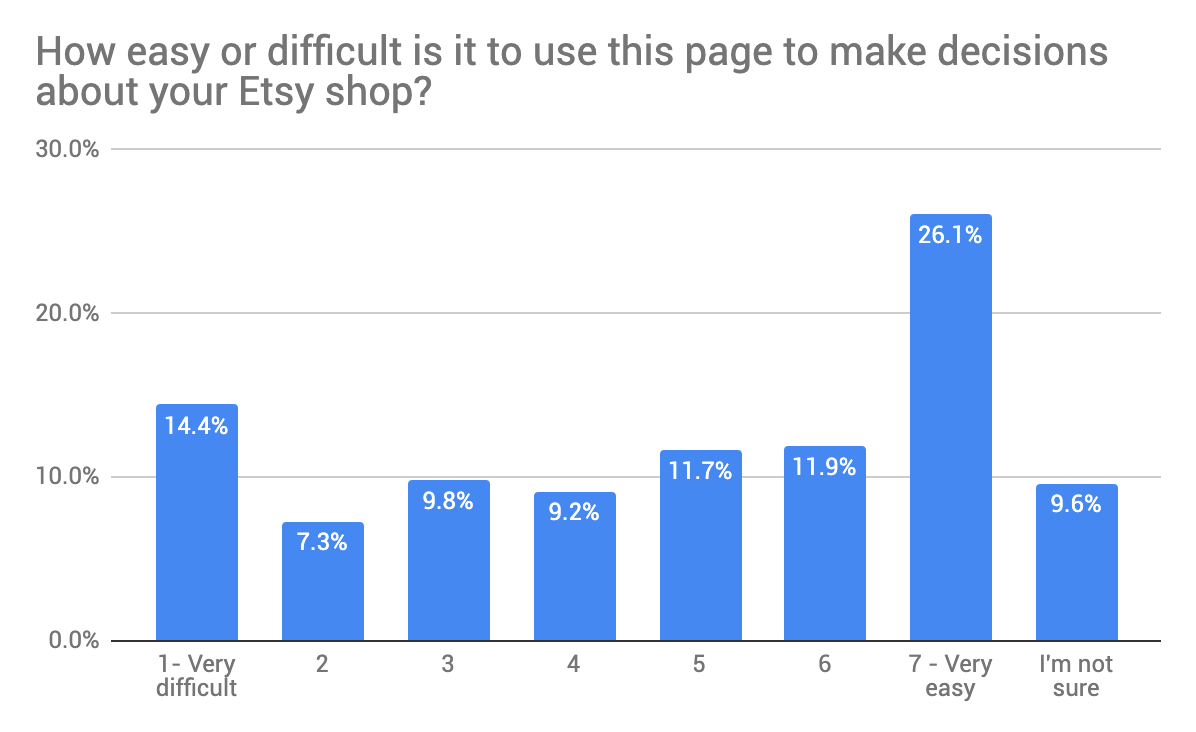
The sellers who said it was confusing had noticed the numerical discrepancies between Search Analytics and Stats. Here’s a quote from one of the survey respondents:
I don’t understand this at all; the numbers don’t tally with my results and I find it hard to believe … Seems like something’s off.
Another chance
Leadership acknowledged that the team wasn’t set up to succeed. Rather than disbanding the team, Etsy invested more in our work the following year. They added two more engineering squads to our team—meaning that we now had a frontend web squad, a mobile eng squad, and a backend eng team. Each squad had its own PM. This would enable us to build a cross-platform experience and invest in rich data.
I took time to summarize everything we learned in collaboration with my user researcher, Brian Greene, and the designer of Etsy Ads, Angira Shirahatti. Angira’s research for Etsy Ads often had relevant insights for my work, so we decided it would be best to collaboratively synthesize insights. We created personas and design documentation from all our user research.
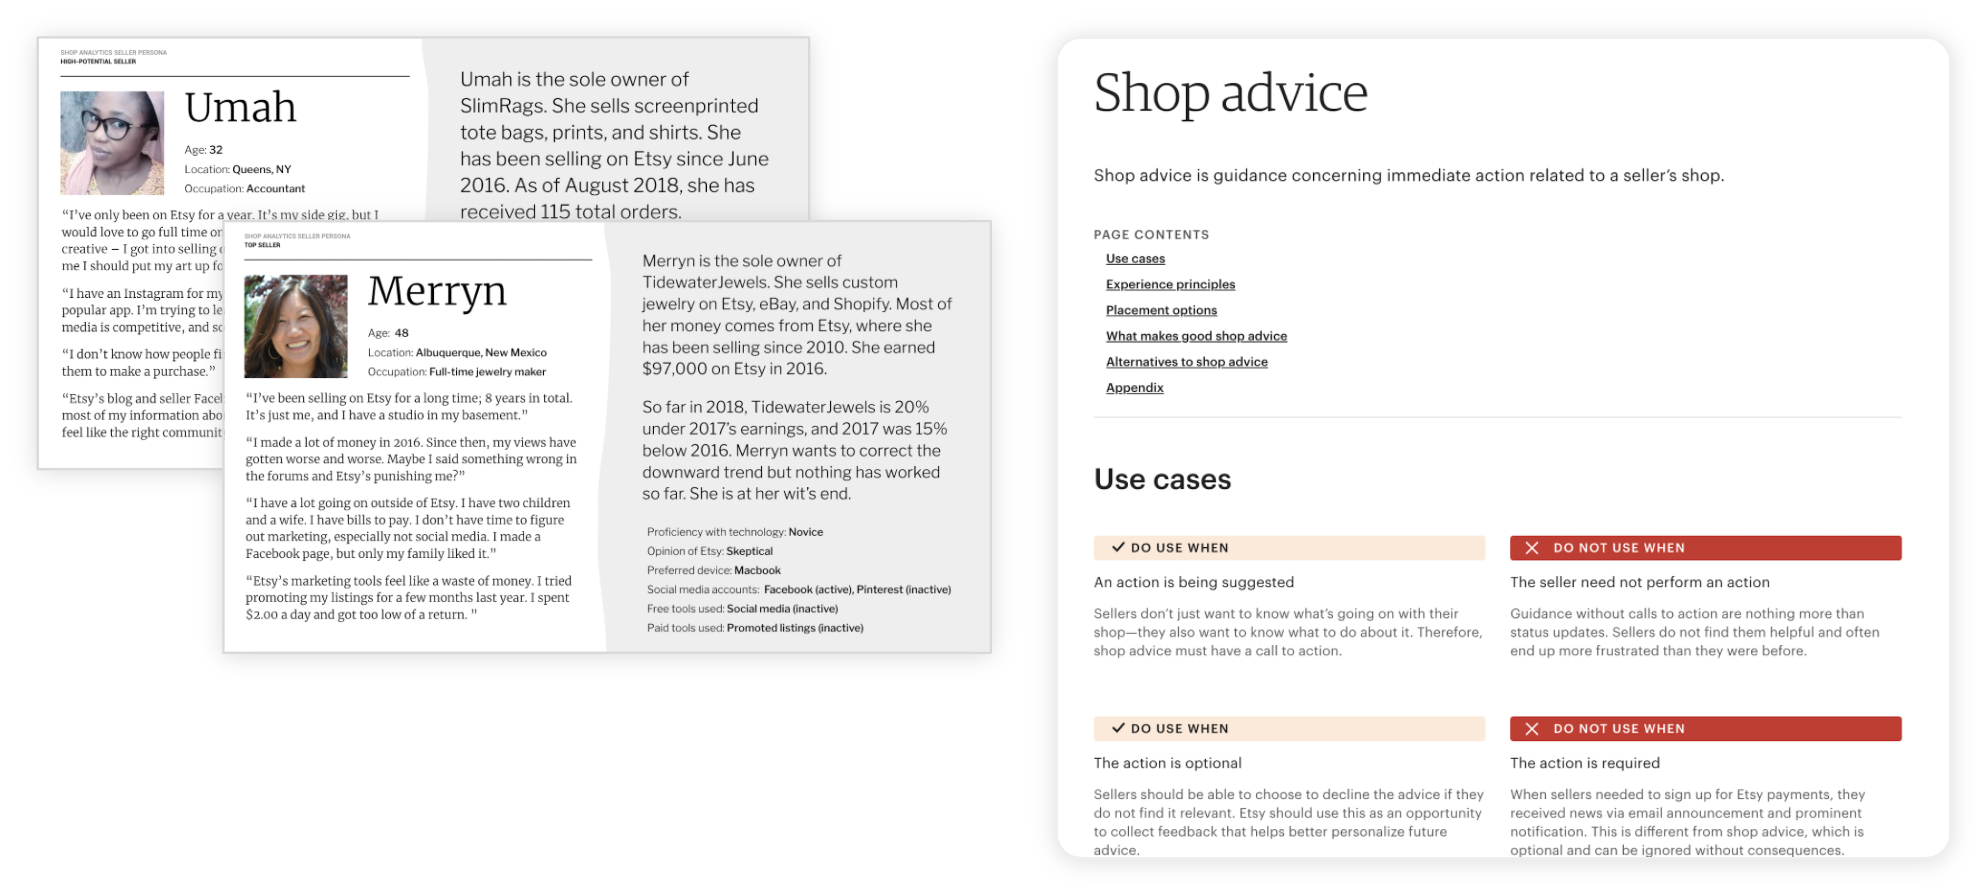 Personas and design documentation from all the user research we did that year.
A major takeaway from this work was that our first iteration zoomed too far in. In other words, sellers needed to understand the full picture before drilling down into specific traffic sources like Etsy search. Instead of focusing at the bottom of the data funnel, we needed to tell a better top-level story so sellers know what needs further investigation.
In other words, we had to start over.
Conclusion
Overall, this project had a major impact on me as a designer. I learned the importance of understanding whether or not you’ve been set up to succeed. I saw firsthand the value of illustrating how certain product and data decisions might affect the user experience. And finally, despite all our issues, Shop Analytics inspired me to involve the voice of customers more often in the design process.
See my next post to learn how we turned the ship around and created success from failure!
Want to talk?
Got feedback, looking to suggest a future writing topic, or want to invite me to speak at your organization? Send me a message and I'll get back to you as soon as possible!